Let me start this post by publicly acknowledging and thanking Jim Sexton, Designated Broker for John Hall & Associates, for his brilliant research (which you are about to see). I am going to comment on and link to several charts. In some cases I will show a small version of the chart in this post and in every instance I will provide a direct link to a full-size version of the chart.
What happened to the housing market in 2008 is quite unlike anything we have ever seen before. Starting in January of 2006, same month sales started coming in lower than the same month the year before. Our boom was over. Looking at number of homes sold, for 29 consecutive months we sold less and less and less. January of 2006 was less than 2007, January 2008 was even lower, etc. For 29 months this continued. Then in June of last year that trend started to reverse. From June 2008 onward we started selling more homes. For the last half of the year, sales each month were greater than that month the previous year. Here you can see Home Sales Per Month for past four years and here you can see Home Sales Per Quarter and Half. It is in this 2nd chart that what happened starts to become visible.
More houses were sold in 2008 than in 2007. But all of that upswing happened between June and December. Sales were actually much lower in the first half of 2008. But look what happened to prices!
Here is a larger version of the chart so you can look. From the 4th quarter of 2007 all the way through 2008 the median price declined every month. Every month.
Most analysts easily see the decline in the median price from 2006 – 2008. It is yip-yapped about in the media almost non-stop. But I don’t know of any (unless they just recently copied this research of Jim’s) who saw the decline throughout the year. The median price for the year was 190k. In January it stood at 220k but by December was 144k.
Please understand that – contrary to almost all economists “thinking” on this subject – median prices are not a reliable tool to track short-term price movement. That is not what I am reporting here. Median prices tell us what is selling (median price is the middle point, half of the sales are for more, half are for less). In this case, foreclosures and lender owned properties. Lots of them. Average Prices suffered a similar fate. Here is a look at how average prices breakdown and compare for the 1st and 2nd half of the year.
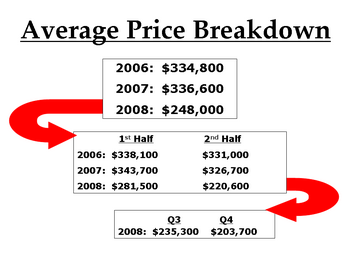 You can see a larger version of the Average Price Breakdown here. Like me, you may be seeing a trend here. Sales prices are sliding. Rapidly. Normally, in any market, sliding prices would be accompanied by falling sales. But here we have the exact opposite happening. Home sales are booming. Well …. some home sales are booming. Lender owned homes, or REO (Real Estate Owned) homes are selling and driving the prices for the entire marketplace. Here you can see the relationship (and the current trend) between REO, open market listings and short sales. The policy Arizona Regional Multiple Listing Service (ARMLS) had for indicating a Short Sale changed, so accurate data isn’t available for the entire year. But let’s take a few facts that we do know: 34% of all valley home sales in 2008 were owned by lenders. However, look at the trend: by December it was up to 52%.
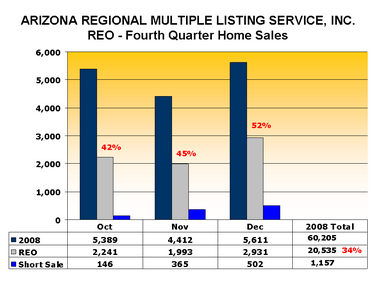 See a larger version of that one here. 24% of all MLS listings are REO. But over half of all the sales are REO. The Pending Sales have an even higher percent of bank owned.
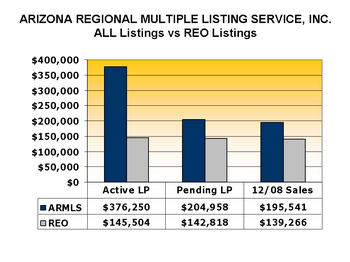
Why?
Short answer, price. Look at the difference in asking prices vs. pending prices vs. sold prices. Notice how the REO numbers are about the same in all three categories. Contrast that to asking price vs. sold prices for all the other listings.
What does this mean to you? If you are a buyer, affordability is back. This is the best news you have had in years. The very best. Interest rates are at historical lows and prices are way down. It has been a long long time since buyers have anything like this – if you are moving here from out of the area or buying your first home, welcome to Home Buying Heaven. Interestingly, if you are selling and buying a larger or more expensive home – I will say the very same thing to you. The extreme downward price pressure is not at all at the lower end – it is the higher priced homes that are taking the big price beating. If you have a higher priced home (right now that is probably anything much above 400k) nothing I am writing here is good news. It only works well for you if you are selling and moving up. If you are in the category of selling a high end home and not replacing it, right now isn’t a very good time for you to sell. Not trying to be negative here but wanting to treat you like I would personally like to be treated: give me all the relevant facts.
For everyone else, this isn’t simply good news, it is nothing short of fantastic. I hope you can take full advantage of this golden opportunity.