The Market Changes Yet Again

“The report of my death was an exaggeration” 

 — Mark Twain

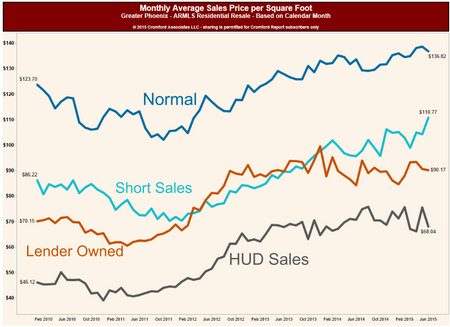
2022 ended in a whimper. After a promising spring buying season, the market sagged under the weight of affordability issues – largely courtesy of rapidly rising interest rates.  The seemingly unstoppable sellers’ market that began the year, in fact stopped.  By November and December of 2022, the valley’s market landed squarely in the buyer’s camp.  That buyer’s market lasted approximately 4 weeks (qualifying for the shortest buyer’s market on record in the valley).  But that is so 2022.  Where are we in 2023?
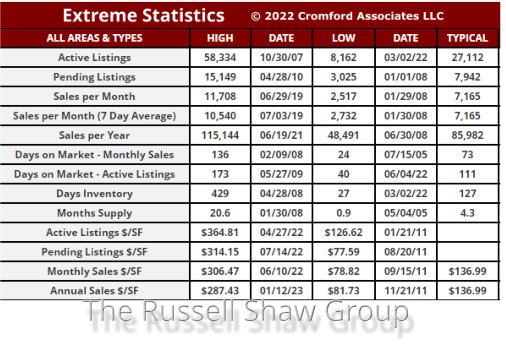
Most buyers and sellers would be surprised to hear that the greater Phoenix real estate market is primarily a balanced market – and is now tipping in favor of sellers.  But it’s true.  Why doesn’t it feel that way? We think it feels unbalanced primarily for 4 reasons:

1. Appreciation has been strong since 2015 making the relatively minor 2022 price correction feel awful to sellers by comparison.

2. The number of transactions (market shrink) are much lower than normal as buyers and sellers headed to the sidelines.  Sellers feared equity loss, buyer’s feared rising housing expense due to increasing interest rates.

3. Human emotion – it’s not what’s true but what feels true. Skepticism is the current market emotion.  Therefore, improvement is viewed with suspicion.

4. Not all valley cities are having the same experience.  Of the largest 17 cities, the Cromford Report shows 4 currently in a buyer’s market (Goodyear, Queen Creek, Maricopa, Buckeye), 3 balanced (Gilbert, Peoria, Surprise) and 10 in a seller’s market (Fountain Hills, Paradise Valley, Chandler, Cave Creek, Scottsdale, Phoenix, Avondale, Glendale, Mesa, Tempe, Gilbert)

𝗠𝗲𝘀𝘀𝗮𝗴𝗲 𝘁𝗼 𝘀𝗲𝗹𝗹𝗲𝗿𝘀:  Now is a good time to sell if you have owned your home for 2 years or more.  The Cromford report gives these appreciation numbers for sellers : “ The long-term appreciation rates for homes in Greater Phoenix are as follows using January sales to date:  25% for 2yrs., 50% for 3yrs., 63% for 4yrs., 70% for 5yrs., and 86%+ for 6yrs or more.”  Balanced markets mean little to no downward pressure on pricing.  However, demand is much quicker to shift than supply is.  If interest rates rise, we could see a demand drop once again putting downward pressure on pricing.

𝗠𝗲𝘀𝘀𝗮𝗴𝗲 𝘁𝗼 𝗯𝘂𝘆𝗲𝗿𝘀:  The buyer’s market lasted for a short 4 weeks – November/December of 2022.  Interest rates have now settled back to below historic averages.  In a balanced market, competition amongst buyers is minimal (i.e. no spiraling bidding wars).  Prices declined around 13% in 2022 – providing buyers a better value.  Don’t be caught waiting for further price drops when the market numbers don’t support that happening. As we mentioned above, balanced markets mean little to no downward pressure on pricing.   Also, interest rates are still subject to change.  They go up fast, and down slowly. Take advantage of the relative (and perhaps temporary) interest rate stability.  Be skeptical of interest rate forecasts.  To quote Michael Orr “No-one has ever been very good at forecasting mortgage interest rates more than a couple of weeks in advance. This includes the Mortgage Bankers Association and it especially includes Goldman Sachs whose track-record on interest rate forecasts is extremely poor. This is not saying much because there is no-one who gets them right more than by random chance.

Any time spent listening to people making interest rate forecasts is time you could have spent more productively.”

None of us can predict the future.  But at the moment – this market is a green light for both sides.

Russell & Wendy Shaw

(Mostly Wendy)
Signs of a cooling market

The Phoenix housing market is cooling, but it is far from cold.  Here are some interesting numbers from the Cromford Report.  From April 1st to October 1st, the number of homes for sale in MLS rose 92% going from 3,591 to 6,883 active listings (supply). In the same time frame, listings under contract dropped 9% (demand). Rising supply with lowered demand says the market is shifting.  Especially concerning is the lowered demand from owner-occupying buyers who are the heart of the housing market.  But before we panic, it is important to note that a count of 6,883 active listings is still extremely low. To put that in perspective, supply is still 45% lower than the pre-pandemic 2019 seller market and 68% below the last balanced market of 2014.  As of the writing of the newsletter, the active listing count has just risen above 8000 for the first time since late 2020.  But even with the numbers remaining well below normal, the rising trend is notable.  In “normal” markets the supply typically does not rise between April and October.  But it did this year. Additionally, other sources of inventory are around the corner.

Possible supply increases

Forbearance agreements are expiring – causing many to expect additional supply of homes for sale from troubled homeowners.  While most people in forbearance retain their homes, about 20% on average elect to sell.  Add to that another anticipated source of homes for sale: the iBuyers (Open Door, Offer Pad, Zillow, etc) The iBuyers bought very heavily – in what appears to almost be a turf war over who could buy the most.  As of this writing, Zillow has just announced they will not purchase any more homes through the end of 2021.  Given the number of homes they purchased, it is not surprising they called a halt, but this will affect demand.  The total iBuyer purchases hit an all-time monthly high in August with 1145 homes purchased (up 533% over August 2020).   Add to that September buys of 1062 (up 471% over last year) and they are carrying a lot of inventory that is scheduled to arrive to market soon.

Where is our market heading?  It is hard to guess given the trends have been somewhat masked by the investors dominating the market.  But, we think most likely sellers will find 2022 a very different market than 2021.  If you have questions about the market or cash offers vs traditional selling, contact us!  We are always here to advise and help.

Russell & Wendy Shaw

How’s the Market?

About that real estate market of ours – it certainly was impacted by the pandemic.  Perhaps the biggest surprise to most people is what the actual impact looked like rather than what they assumed would happen.  Let’s examine the impact in the key areas that compose a real estate market.
Prices

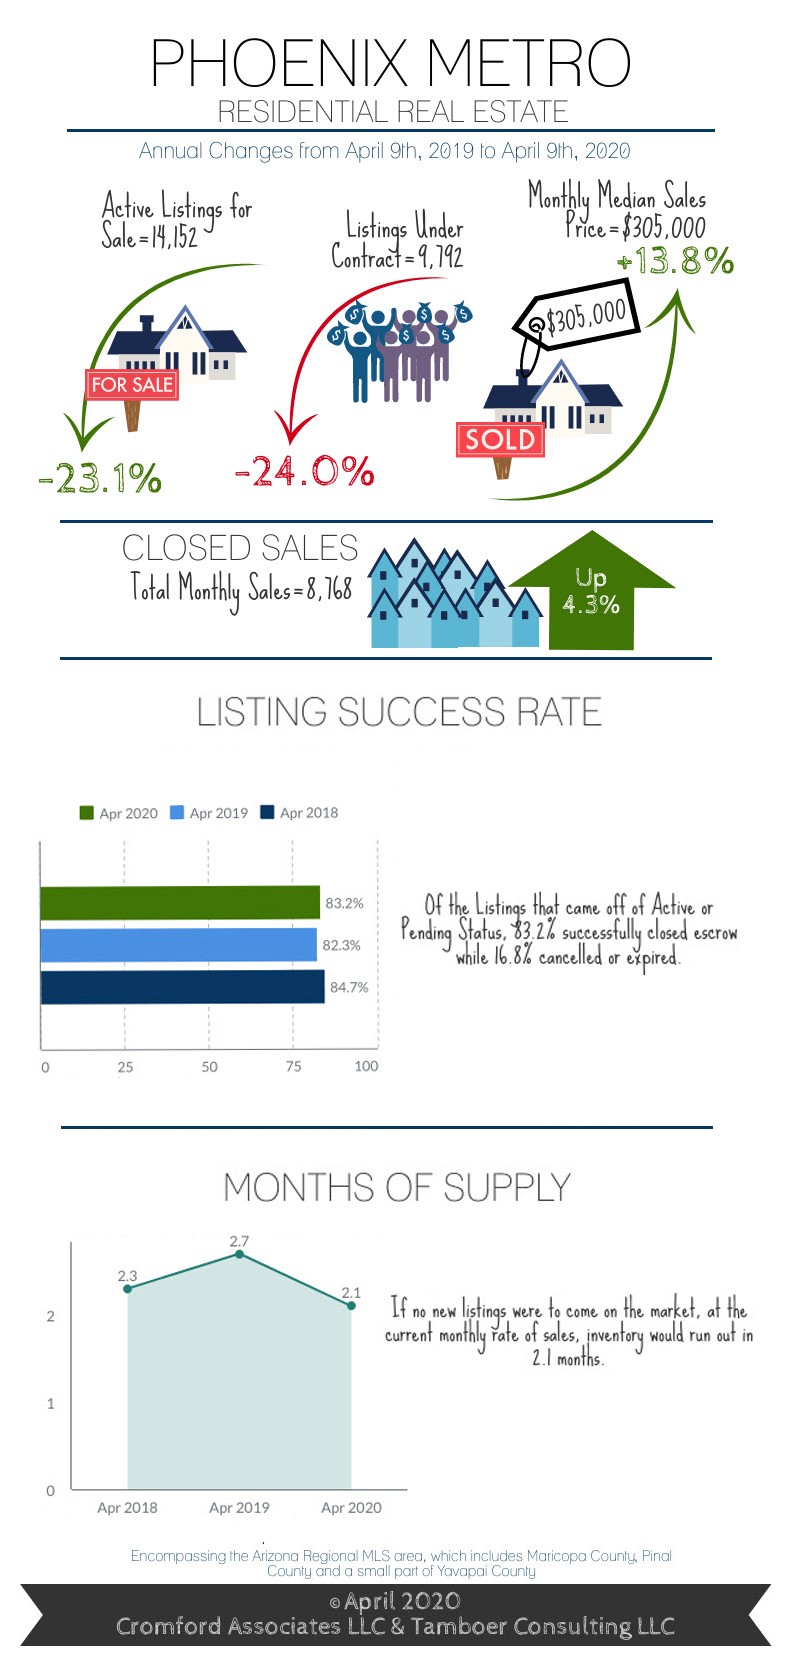
The primary concern for most home owners in real estate is pricing.  When a sudden economic shift occurs (such as a pandemic, war, acts of God, etc.) fear tends to take over the financial markets.  This can cause dramatic swings in the stock market as well as other industries – but the housing market is very slow to react.  In fact it can take months or even years to react.  The Valley has been in a very strong sellers’ market for a long time. A few months of pandemic was not enough to really move the needle on pricing.  But like normal times, different price points behave differently.  It may surprise you to hear that prices in the under 500K range actually rose during this time.  The 500K-1 million market saw some minor softening in pricing as did the upper luxury market of over a million.  But any reports to the contrary, sellers do not need to give away homes or take low priced investor offers to sell.  The average home is holding steady and improving in value.  Even the luxury market very recently is showing renewed strength.

Supply/Demand

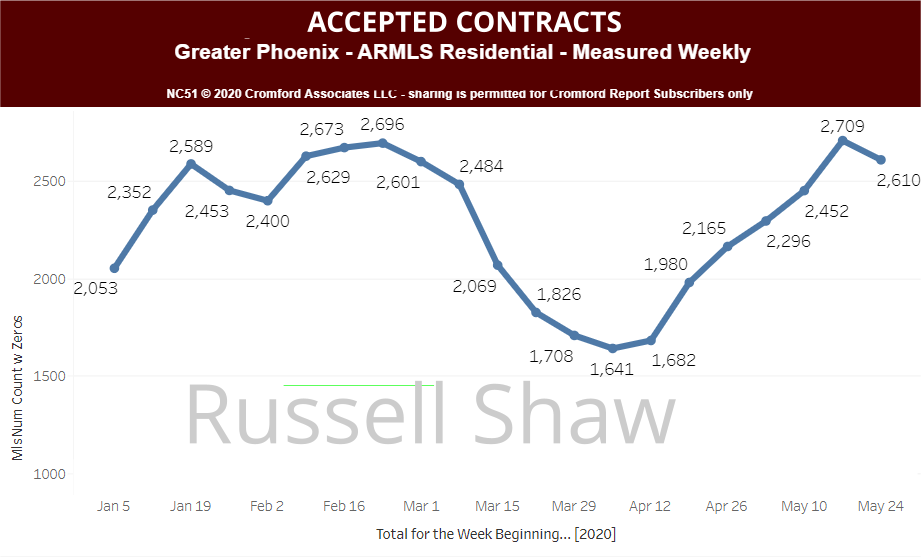
Real estate prices are tied to supply and demand. As long as the demand exceeds the supply, prices will rise. The bigger the gap, the faster prices increase.  So what happened to supply and demand?  The market was at the beginning of the spring selling season – typically the most active time of the market- when the pandemic hit.  By the second week of March, the news and subsequent shuttering of states finally impacted the market.  Within a two week period a large percentage of buyers exited their contracts (including the “iBuyers” such as Open Door, Zillow, Offer Pad).  The “back on market” status did a jump as these cancellations accelerated.  In fact demand dropped a whopping 39% – indicated by the number of contracts accepted.  So while demand was dropping rapidly, what was happening on the supply side of the equation?

Sellers fell in to one of two camps.  One group, fearing that prices were headed for a fall, jumped on the market immediately to avoid the looming future price drops they feared. This caused a short term spike in new listings of about 2000 homes.  The other group, concerned that “no one would buy now” or concerned about allowing buyers in to their homes, moved to the sidelines removing their homes from the market.

The net effect was a shrunken market.  As supply and demand fell in nearly equal measure, sellers retained the control as they have for years but less transactions occurred.   To sum it up succulently, Michael Orr of the Cromford Report writes:

 “I would say the impact on the Greater Phoenix housing market has been less so far than many people expected. Transaction volumes are lower than normal, but not dramatically so. Home values have not been noticeably affected at all and are likely to increase during the second half of the year.”

What is selling has changed – Another effect of the pandemic was the mix of what was selling changed.  The above 500K saw more of drop in demand than the below 500K.  Stock market fluctuations tend to impact the above 500K market, and the pandemic’s economic impact was certainly reflected in the stock market.  Jumbo loans were temporarily suspended by some lending institutions and others changed their lending criteria for the worse.  Consequently, what was selling changed.  The upper market faltered, while the below 500K began to dominate the solds – dropping the average price per square foot price.  When you have fewer high priced per square foot homes selling – the overall average for the market drops.  So if you see headlines saying “price per square foot is dropping” implying prices are dropping, be aware that the author has not examined the underlying numbers.  Another interesting factor is that the 55+ community homes have suffered in sales numbers.  Perhaps not surprisingly, considering they are the most vulnerable population in the pandemic.

Summary:

The market is expanding and moving rapidly to catch up with the 2019 numbers.  If you are a buyer, please don’t wait for price drops that are not coming.  Buy now while interest rates are at historic lows.  If you are a seller, please don’t panic and sell to investors for fear that prices are plummeting or that your home cannot be marketed to the entire pool of buyers safely.  We are armed with tools of the trade like virtual open houses and selling without physical showings.  All of which protect you as well as your pocketbook.  And that remains our goal – unchanged by market conditions- to protect you, our client.

Russell & Wendy Shaw

(mostly Wendy)

The Housing Market Isn’t Stopping!

The real estate market is still alive and functioning –despite social distancing and stay at home orders. Like food, shelter is not optional. Understandably there have been changes. The number of transactions has dropped, but prices are not dropping as supply continues to be much lower than current demand.
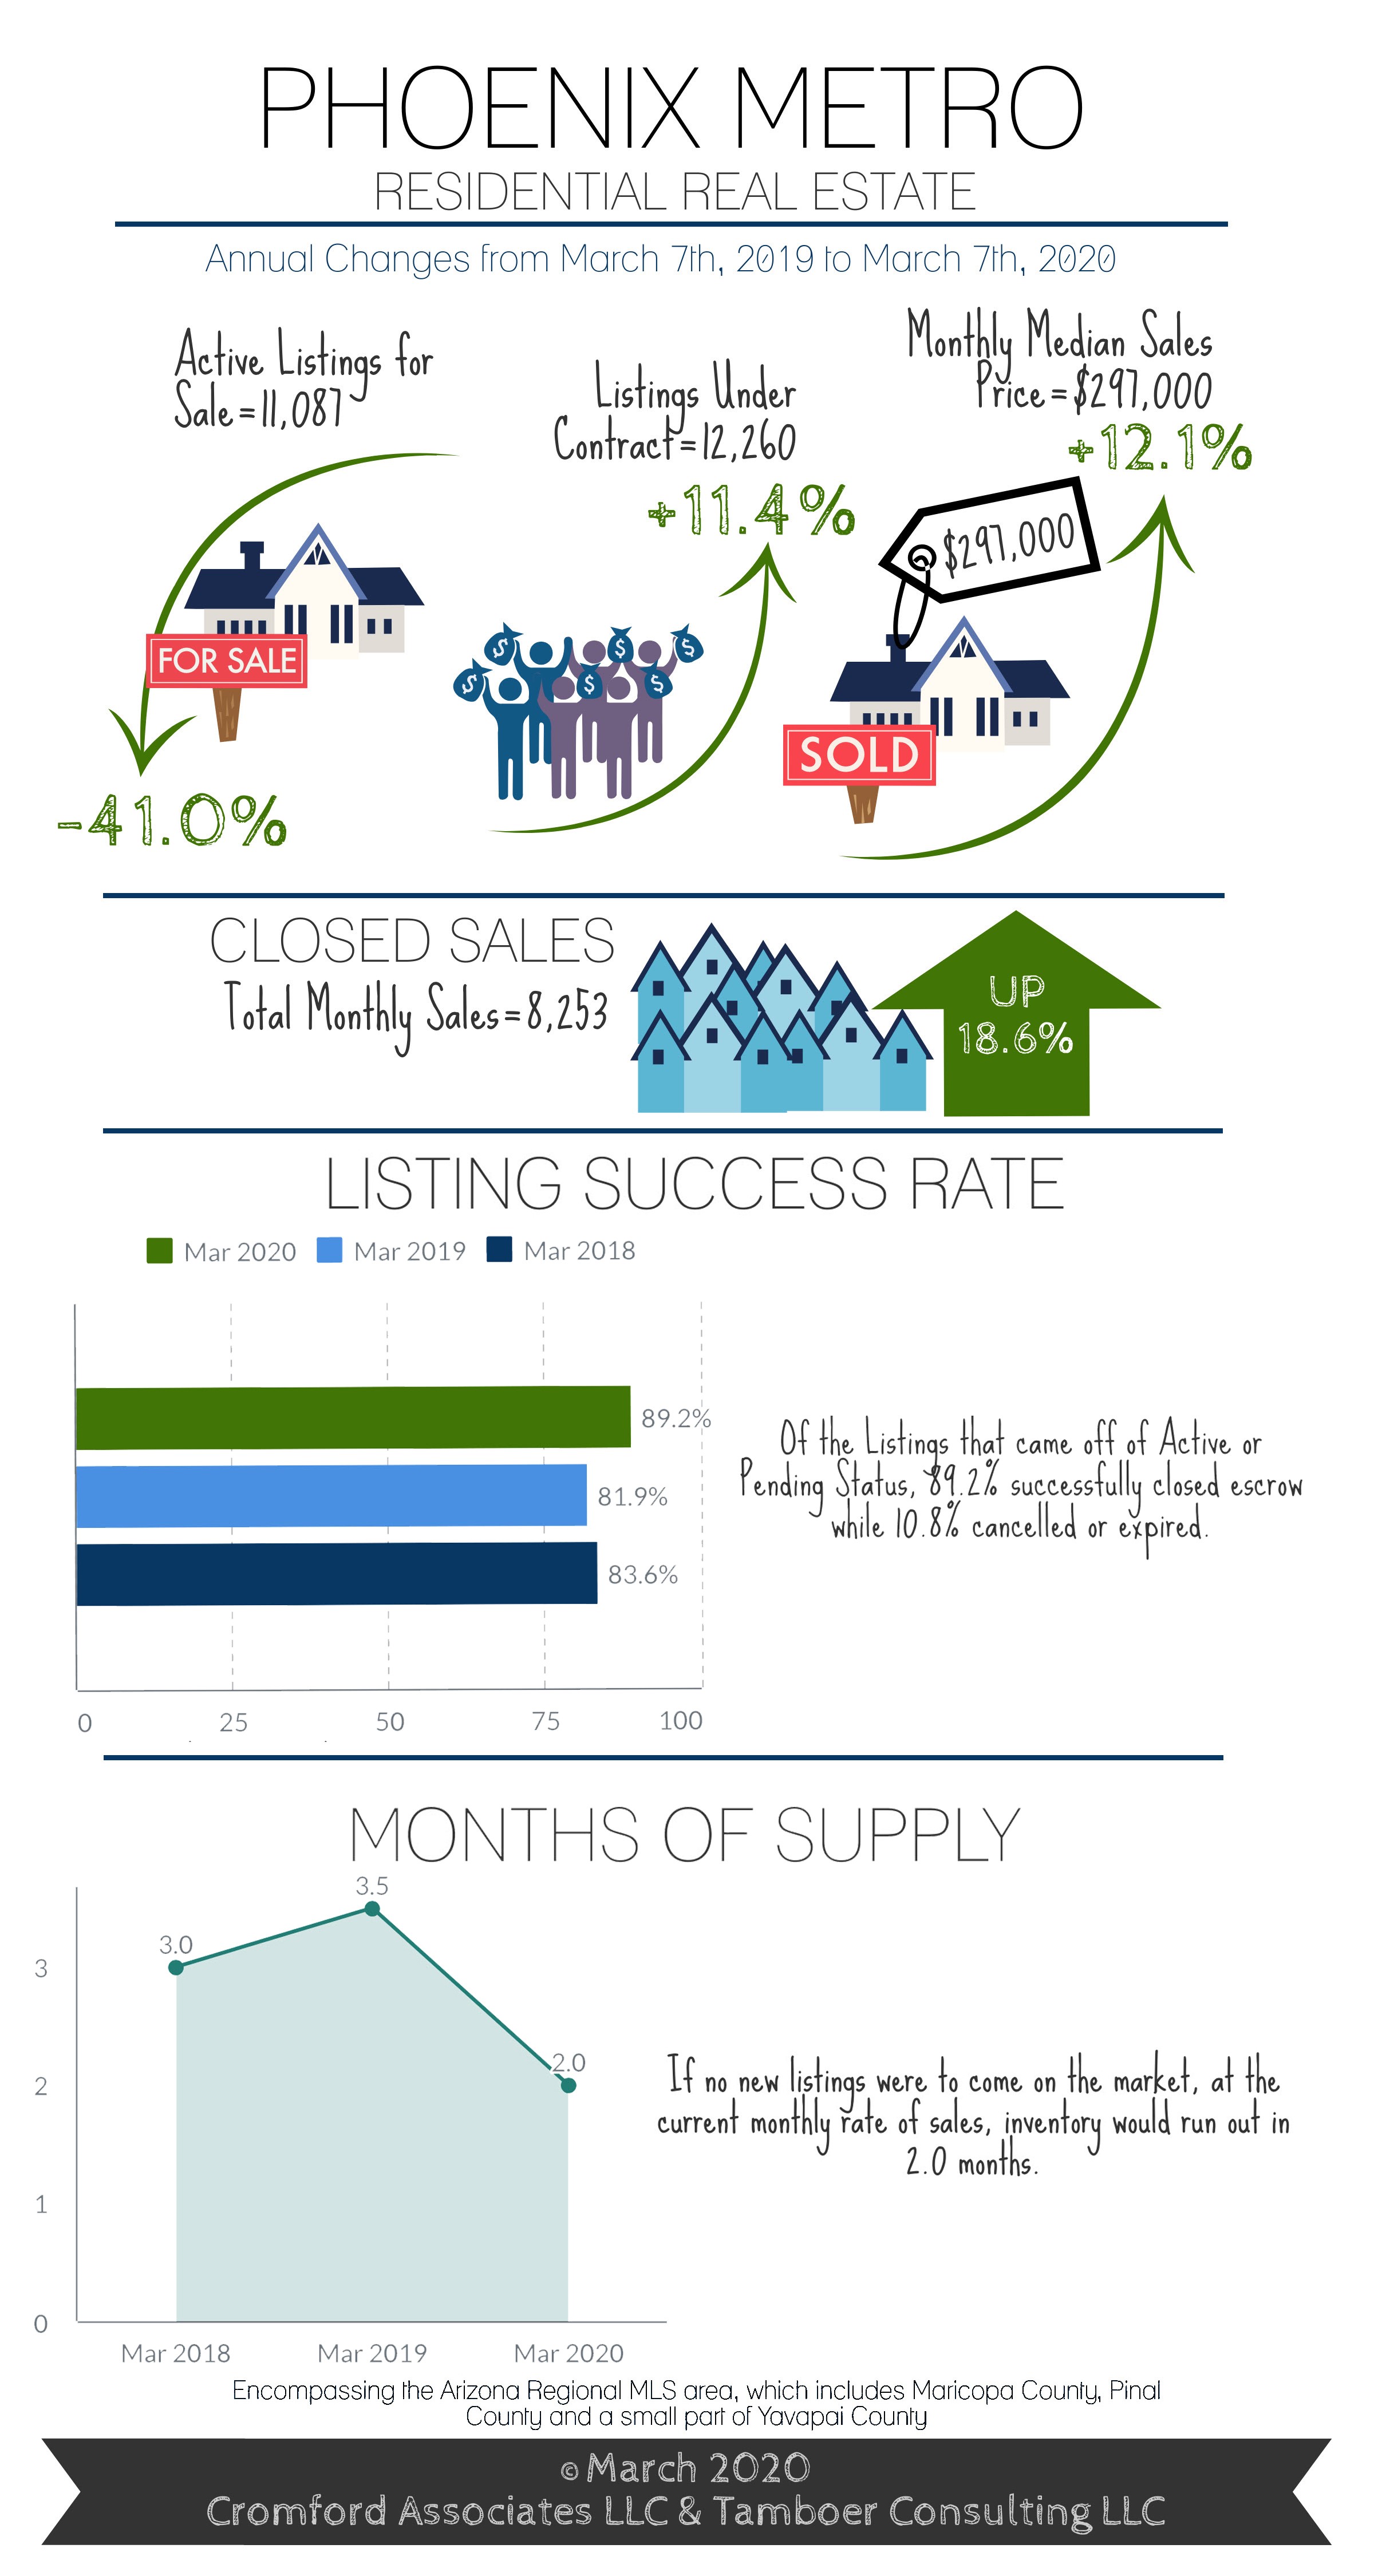
2020 began with such a disparity between supply and demand that many buyers were shut out of the housing market trying to compete against multiple offers (we would receive as many as 10-30 offers on homes). Add to that the iBuyers and investors trying to pre-empt the purchasing of homes prior to coming to market and you can see why normal buyers had a very tough road to obtain housing. The extreme lack of homes for sale resulted in accelerating prices – causing many to compare it to 2005 (erroneously I might add, as 2020 had very different traits from what was fueling the 2005 marketplace).

And then came COVID-19. To quote Tina Tamboer, Senior Housing Analyst with The Cromford Report:

“The COVID-19 pandemic came in like a wrecking ball in March shutting down tourism and crashing the stock market single-handedly over the course of a few weeks. Hedge funds and iBuyers (funded by Wall Street) bowed out of purchases and vacation rental buyers put their plans on hold.  This is providing much needed relief to normal home buyers, if only they could leave their house. Stay-at-home orders to stem the impact of the pandemic has “pinched the hose” on what is arguably one of the hottest housing markets in the country.  This is causing a build-up of pent up demand that will undoubtedly return with some gusto when travel restrictions are lifted and a level of stability returns. Do not expect prices in Greater Phoenix to drop like they did in 2008, however. Back then when investors pulled out of the market, prices were so high that families making the median income could only afford 27% of what was selling. This time around as investors once again pull out of the marketplace, families making the median income can afford 68% of what’s selling with today’s incomes and interest rates. This is well within normal range and puts regular home buyers in a better position to pick up the pieces left by Wall Street and vacation rental investors.”

As usual, housing markets are not only local in nature but different price points within that local market behave differently.  While the under 500K price point seems to be functioning well, the luxury market has felt a larger impact.  Tina Tamboer further explains:

“… The effects of COVID-19 span the job market, stock market, corporate profits, and exchange rates. This has had the highest impact on high-end luxury market buyers. Not only are these buyers restricted from leaving their home cities at the moment, they have instability in their portfolios as well.  Under these circumstances it should not come as a surprise to see that weekly contract activity over $500K has slowed down by 64% since their peak on February 24th while price points under $500K have only seen a 30-40% slow down.”

If you are struggling to understand whether to buy or sell in this market, and the changes we have put in place to do so safely, please contact us. We are here to answer questions with facts and advice.

Officially a Frenzy: 11% More Contracts Than Listings For Sale Contracts Over $1M Up 60% Over Last Year

The COVID -19 virus and the housing market are squaring off.  It is early in the fight, so we are loathe to predict too much at this point.  In our 42 years of practicing Phoenix real estate in all its iterations – a pandemic virus is one we haven’t lived through.  But “disasters” whether war or terrorism or a housing bubble – all have one thing in common.  They do not survive long term.  So really, what is the worst case?  Demand drops until the virus abates or is medically solved (vaccines, medication etc.) Demand can only be suppressed for so long.  In the long run, the basic needs of man – food and shelter, always prevail.
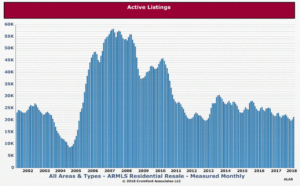
Given how strikingly low the valley’s housing supply is – our market has the potential to weather a significant drop in demand.  Let’s look to the Tina Tambour of the Cromford Report for some interesting statistics.  Tina points out the number of active homes for sale is running chronically below the number that have contracts on them – i.e. the active supply is being gobbled up by contracts:

“For every 100 active listings in the Arizona Regional MLS there are 111 that are already under contract.  Greater Phoenix is officially a frenzy and it’s only March.  We can expect to see this continue at least through May without relief as buyer demand is typically highest in the Spring.

It’s even more dramatic in the Southeast Valley, West Valley and North Phoenix and all areas where prices land between $175K-$300K.  For a stark example, on March 7th in Glendale there were 3 properties for sale between $175K-$200K and 25 under contract.  In Chandler there were 3 properties active between $200K-$250K and 37 under contract.  In the North Phoenix Moon Valley area there were 8 properties for sale between $250K-$300K and 30 under contract.

There is a reason why people continue to pounce on what’s available for sale.  The average price for a 1,500-2,000sf home is now $331K and continues to rise.  That may seem alarming considering it was $324K at the peak in 2006, but contrary to popular belief it’s more affordable today because of the interest rates.  In April 2006, with an average of 6.51% the monthly principle and interest payment on a 30-year fixed loan with 10% down was $1,854.  Today at an average of 3.45% the same home is $1,331, a savings of $523. More recently, over the last 16 months despite prices having risen 9.4% for median-sized homes the monthly payment dropped by approximately $112/month.”

In short, whatever the impact to the market – we will keep you informed.  We would urge you to not be overly concerned at this point.  We have one of the strongest housing markets in the country and any change to that would be a temporary one.  This too shall pass.

Supply and Demand Seesaw

The seesaw of supply and demand is our best barometer of the health of the housing market – so naturally we closely watch it.  We have been in a seller’s market for such an extensive period that like most veteran agents, we are expecting a correction.  A rebalance of the market we hope will come in the form of a gradual increase in supply due to a lessening of demand; ultimately resulting in a balanced market.
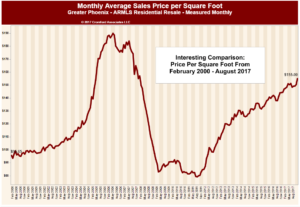
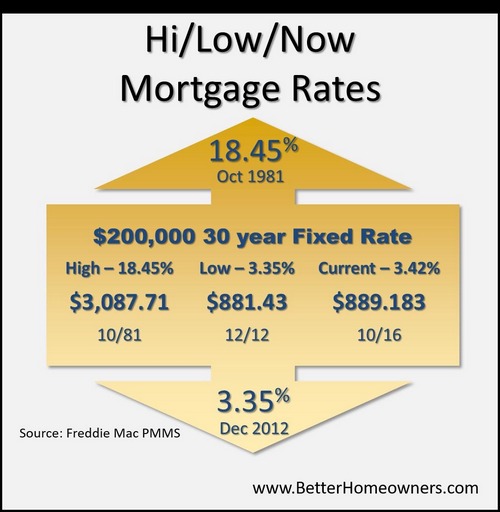
In fact some early signals seem to indicate supply is building in most price points.  Here are some numbers from the Cromford Report:

“October marks the 4th month in a row that supply has continued to rise between $200K – $400K, which is good news for many buyers as it provides them with more choice and fewer competing offers.  However, for those buyers with budgets under $200K, this trend in supply doesn’t apply to them and their choices are still extremely limited.. 

As usual, nothing is quite that simple.  Supply comes from homes already on the market (not yet sold) and new listings being added (or built).  But at the same time the supply seems to be increasing – the first weeks of October showed a dearth of new listings coming to market.  In fact, new listings hit historic lows for any previous October.  The Cromford Report further explains:

We are examining the first week of October in more detail to study how new listing counts dropped unexpectedly. We counted 2,017 new listings in Greater Phoenix during the first full week which is down dramatically from the same week in 2017. The overall decline is 23% year over year and this is the lowest number of new listings we have ever seen for the first week of October. The previous record low was 2,343 in 2014….

For whatever reason, sellers are surprisingly rare this month. Even if we change the measurement week to Oct 3 to Oct 9, the picture does not change – new listings down 25% from 2,520 in 2017 to 1,885 in 2018. This latter total is once again the lowest we have ever recorded for those dates.

What is happening?  We can only speculate about why October has had such a low supply of new sellers.  Certainly consumer sentiment is a factor.  A large stock market “correction” can affect the market.  Politics can of course play a role.  Also, interest rates affect not only buyers but sellers too.  Again, the Cromford Report points out:

Mortgage rates tend to increase when the economy is strong…. People usually worry about higher rates discouraging buyers and while that is a reasonable concern, I am also of the opinion that higher rates discourage sellers, because in most cases they are going to move somewhere else and pay a higher rate too. If they have the option to stay put, they may choose to do so when rates are increasing.

 … Freddie Mac reported an average of 4.63% during September for the 30 year fixed. This is the highest we have seen since May 2011, more than 7 years ago. Of course in 2011 this seemed like a very low rate because we had experienced rates over 6% almost continuously between 1970 and 2008, with occasional short periods in the mid 5s.

Now we have a lot of homeowners with loans bearing rates of 3.5% to 4.25% taken out over the past 7 years. To move to a new home, they will need to pay off that cheap loan and take out another at closer to 5%. This effect is likely to be a drag on the supply of re-sale homes for a long time to come. It is likely to be good news for remodeling companies as many home owners decide to preserve their cheap financing by staying in place and spending their upgrade money on improving and modernizing their existing home instead.

Of course we cannot ignore the demand side of the equation.  A gentle lessening in demand appears to be underway – which ultimately effects supply.  When fewer buyers buy, supply typically begins to rise.  Which piece of the equation will affect 2019?  Will the lessened demand help shift the market towards balance or will sellers be reluctant to sell causing supply to remain scarce?  Either way, we will continue to monitor it and comment on it.

In the meantime, we want to give our heartfelt thanks for our wonderful friends and clients who place so much trust in us.  We are grateful every day.  We wish you all a wonderful holiday season.

Russell & Wendy Shaw

(Mostly Wendy)

Welcome to 2018

We hope you all had a wonderful holiday season!  Now that we are off to a fresh new year it makes sense to note where the market currently stands.

Supply

Undoubtedly our serial readers are already well aware that the 500K and under range has been in a “sellers” market for all of 2017.  What most may not know is that inventory usually sees a build up in the fall as demand tapers off.  Fall 2017 saw a very minimal increase in inventory and in the under 200k single family supply is so paltry as to seemingly be headed for extinction. Entering 2018, active Listings are down 12% from this time last year.   There appears to be no relief on the horizon.  As our favorite real estate market watcher the Cromford Report states:

It is easy to get complacent about the low inventory and assume that this is somehow the “new normal”. The long term decline in active listings just keeps going and we have now reached the point where days of inventory is the lowest we have seen for week 50 since 2004 (at the height of the bubble). …To try to get a handle on what life is like in the regular market, let us focus on homes priced at under $500,000 in Greater Phoenix. The inventory for this segment is 52 days. If we use $250,000 as the price limit we have just under 40 days of inventory. These are not normal readings and we start to wonder how low can these numbers go.”

This means buyers are going to have an even tougher time buying than last year in any price range other than luxury.  For most sellers, they should enjoy competition from buyers and stronger pricing.

Demand

Demand has remained relatively stable and unremarkable especially compared to its counterpart supply.  Demand was on a weakening trend in the 3rd quarter but that seemed to shift upwards mid-November and certainly provided a busier than normal December.  An interesting side note is that buyers are now primarily in-state buyers (i.e. local house changers) .  The Cromford Report notes :

 “… migration into Arizona is weaker than it was during the 2000-2007 era. In 2004 we saw 30,564 purchases by out of state buyers. 2017 year to date is 16,443 …The total sales count is lower and the percentage of sales going to out of state buyers has dropped from 20% to 16%…The flip side of this is that in-state demand has increased from 80% to 84%. Areas that appeal most to in-state buyers have seen stronger appreciation.”

Appreciation

Supply and demand ultimately dictate appreciation.  It should come as no surprise that appreciation was greatest in the lower price ranges due to low supply.  Turning back to the Cromford Report we can see exactly how true this is:

”After peaking on July 28 at 8.6% the appreciation rate for all areas & types went into a declining trend until November 9 when it bottomed out at 3.6%. It then changed course and over the last 5 weeks has risen sharply to reach between 7% and 7.5%…. Such a rapid change in direction is quite unusual.

The overall appreciation rate based on annual sale price per square foot in Greater Phoenix is 6.2%.  However, supply and demand are not the same by price range. The greatest appreciation rates are under $200K due to a lack of new construction that would typically balance out the supply shortage.  Sales under $200K are 33% of all sales this year, so their rate has a large effect on the overall average.  New multi-family and single-family homes are being added to the $200K-$500K price range to accommodate increased demand, but it’s still not quite enough.  The market is balanced between $500K-$1M, while supply is still higher than demand over $1M despite a 10% rise in 4th quarter contracts.  As a result, appreciation rates are as follows by price range:

  • Under $200K:  7.7%
  • $200K-$500K: 3.5%
  • $500K-$1M: 1.7%
  • Over $1M: 0.1%”

Agents

We rarely talk about real estate agents – although they certainly can impact the marketplace in subtle ways.  It may be of interest that there was a 6.6% increase in the number of real estate agents since last year as rookies continue to enter the field. While agents certainly don’t set the marketplace (supply and demand does) they certainly can influence the buying and selling experience. Agent skill impacts the counsel clients receive on market behavior or not; negotiate the highest market value or not.  They should be the client’s biggest advocate and legally in fact have a fiduciary relationship to the client.  As the institutional investment companies are swarming the valley (Offer Pad, Open Door, etc.) sellers can learn the hard way the impact that a missing real estate advocate has in terms of reduced proceeds.  Particularly disturbing is the institutional buyers’ offers of “no commission sale” while charging fees in excess of 9% – far beyond what might be charged as a commission.  Add in the typically lower than market value and imaginary “repair costs” and sellers are paying dearly for that lack of representation.  Lower than true market value sales can impact appraisals and subsequent neighboring sales – a sobering thought for all of us vested in defending neighborhood values.

As 2018 continues to progress we will endeavor to keep you apprised of the emerging trends.  Of course every home sale has its own concerns, so please don’t hesitate to contact us for a customized analysis of your neighborhood.  Here’s to a wonderful 2018!

Russell & Wendy Shaw

(Mostly Wendy)

How’s The Market?

Real estate affects everyone here in the valley – even those who don’t buy or sell. So being a Realtor, I get to see firsthand the level of interest the subjectTravis graphic for July attracts. The second most common question I get asked is “How’s the market?” (The most common one being “Are you that guy on TV?”)

For whom?

For the 800k seller in north Scottsdale? Or the 250k seller in Avondale? The answers are very different. Buyers in the 800k range have many homes to choose from. Juxtapose that to Avondale which currently has the hottest seller market in the valley. Glendale is just behind Avondale -but still a red hot market for sellers. Hot seller markets are simply markets that have lots of buyers – and too few sellers. It is always supply and demand.

The sticking point is that supply and demand numbers are not universal to an area or price point. So when the news reports “it’s a red hot seller’s market” take a moment and look at the valley as a series of sub-communities – each with their own numbers.

To quote directly from Michael Orr’s Cromford Report:

“Multiple offer situations are increasing. If buyers are wanting to spend more than $500,000 then they are in luck – supply is much more plentiful above that mark, though a few very popular areas like Arcadia have relatively slim pickings. During May even those upper price ranges saw a downward trend in active listing counts, but not enough to cause any real problems for most buyers. If today’s normal demand can cause supply to drop as much as it did in the last month, then buyers are going to have an even harder time if demand were to grow. This is especially true for the entry level market which is desperately short of homes for sale or rent.

The price trend is now very different for the low end, where strong appreciation is likely, and for the high end where a gently drift sideways is more likely, except in those areas where inventory is unusually low…

We note that the monthly median sales price has increased much faster than the monthly average price per sq. ft. The low end of the market is not pulling its usual weight due to the painfully low levels of supply in so many areas. This generates insufficient sales to keep the median down at its natural level. Prices are not really improving as much as the median suggests, except in a few very affordable areas, which may not remain so affordable for much longer…

The growing sense of justifiable optimism in the housing market tends to bring out ever more ridiculous articles in the media, usually forecasting doom and gloom ahead. Some even pretend to use mathematics to justify their case.

As John Kenneth Galbraith said (or was it Ezra Solomon; we don’t even know the past for certain), “The only function of economic forecasting is to make astrology look respectable”.

We will continue to stick to reporting the present and very short term forecasts. Right now the Greater Phoenix housing market is experiencing more than usual upward price pressure due to a chronic shortage of affordable housing to buy or rent. The majority of new development is focused on the mid-range or luxury markets, not the affordable market, for understandable business reasons, so there is no imminent solution to this shortage of affordable homes.”

Wondering if it a good time to sell for your price and neighborhood? Most likely the answer is yes. As always, the best answer is a researched answer. We simply need an address to give you a real answer to that question – anytime.