Crystal Ball for 2024

With very few exceptions, the housing market begins every year with a question:  what will this year’s housing market bring?  The truth is that projecting beyond a few months enters one into the field of guessing, as there is no real estate Nostradamus.  But there are data points (courtesy of the Cromford Report) that tell us where we are and what the next few months may look like. 

The 2023 Housing Market ended the year in “balance”.  Of course that is a bit misleading – as there are parts of the valley favoring buyers (think outlying areas such as Buckeye, Maricopa, Pinal County) and others favoring sellers (Tolleson, Anthem, Apache Junction, El Mirage, Sun Lakes, Chandler, Laveen, and Fountain Hills).  Blending two out of balance areas doesn’t really create overall balance in the market place.  This is why knowing the actual conditions in the submarkets is critical for good buying and selling decision making. 

December is seasonally the slowest time of year for real estate and supply drops as homes come off the market for the holidays or expire by year’s end. 2023 was no exception.  But rates declining from 8.0% in October to 7% presented an opportunity for buyers to buy without too much competition and for motivated sellers to sell despite the holidays.  That drop in rates spurred demand even if only mildly and stopped the market from sliding into a buyer’s market. 

Interest rates

Interest rates have been the driving force in 2023, affecting equally both supply and demand.  Buyer demand is regulated largely by affordability, which is a combination of wages, interest rates and prices. The most volatile of these of late being interest rates. But a less visible component in the decision to buy also comes from rental rates.  The valley rental rates have been flat for the last two years courtesy of the increased rental supply from multifamily building as well as entire build to rent housing communities.   When rents are lower than the cost of purchasing – buyers become or remain renters.

Interest rates equally affect supply. Sellers are largely unwilling to replace their current 3% loans only to have to double when purchasing.  This leads to constricted supply.  Less supply combined with less demand amounts to a “shrunken market” and the number of transactions (sales) drop accordingly.  The market went from 110,435 yearly transactions in 2021 to only 86,534 in 2022 and then to an anemic 72,432 sales in 2023.  As the Cromford Report states:

“In a good strong market this number is over 100,00. We are currently below 72,600 and despite the improving interest rate picture, the annual sales rate is drifting slightly lower. This measure is free of seasonal effects, because it measures a whole year of sales activity, so if the market is improving we should see a rising trend, no matter what time of year. Admittedly closed sales counts are a trailing indicator, but it would be reasonable to expect something better than 73,000 if the market is starting to recover its mojo.”

Prices

Supply moves slowly, whereas demand is swift and responsive. If rates drop to 6% or lower we likely will see a spike in demand.  However, Sellers who are not already motivated by personal reasons to move, will be unlikely to move unless rates drop to 5% or lower.  Hence our personal belief that demand will rise before supply will meet it.   This creates the possibility that the market will shift to favor sellers again in 2024.  That is only our speculation, what seems certain is that prices are not headed downward.  The Cromford Report confirms this:

“The last 20 years have shown us that for home prices to go significantly down, we have to have an excess of homes for sale chasing too few buyers. Right now, buyers are indeed thin on the ground, but we still have overall supply well below normal and heading lower. For a housing crash we would need a flood of new homes for sale. The reason it might occur is not important, but without this flood, price will remain stable at worst…

To conclude we have any credible evidence of an imminent crash would be simply illogical. With the CMI (Cromford Market Index which indicates a balanced market at 100) above 100 we should not be seeing significant weakness in pricing, so I hope buyers are not waiting for overall price drops. Individual listings give us price cuts all the time, but these are balanced by new listings coming in at higher levels. Any price weakness is likely to be concentrated in the areas with the lowest CMI, such as Maricopa, Buckeye, Queen Creek (including San Tan Valley), Cave Creek and Surprise. Among the smaller cities, Casa Grande, Gold Canyon and Sun City look the weakest. In contrast we see strength building in Apache Junction and Litchfield Park.”

Summary

What is the takeaway for 2024?  To quote the Cromford Report:

The important stuff will happen in January. Will more than the usual number of buyers emerge due to falling mortgage rates, or will we see a surge in new listings. The balance between these two measures will determine the direction of prices in the first quarter of 2024 and anyone who tells you they already know what will happen is selling you a lie.”

For buyers, we suggest buying sooner than later as we see low probability for price drops.  For sellers, the best advice is one that works in any market:  price properly, spruce up your home to its best showing condition, and assist buyers with closings costs.  Further, as the Cromford Report sagely states:  These are the markets where quality marketing, exposure, and agent representation truly make a difference. We couldn’t agree more.

Russell & Wendy Shaw

(Mostly Wendy)

How To Get Less Money When You Sell Your House

Every day we field calls from sellers checking on what they can do to their home to increase the home’s value prior to sale.  These questions center around improvements such as solar (we don’t recommend) painting (yes!) flooring and so on.  Yet one of the biggest forfeitures of value is “to whom” and “how” we sell.

To whom we sell.  End users always pay the most for any product – whether a home or a car.  It has the highest value to them as they are the ones with the need.  Selling to an investor typically brings a lower value because they are not the end user and there is no emotional connection to the home.  Owner occupants pay more – but even amongst those buyers the value can vary widely depending on how motivated they are and how limited their other options are (i.e. if the home serves a particular need such as dual master bedrooms, handicap accessible, a certain school district, etc.)  In negotiation, the concept “he who needs the deal the most, gives the most” proves true.

How we sell.  When we sell with no competition value typically drops.  The very premise behind capitalism is that an open market sets pricing.  The smaller the pool of buyers exposed to your home, typically the smaller the value.  In other words, you can artificially hold down demand by limiting exposure to your home.  By owner sales and direct to owner investor offers fall in this category.

Even homes that must only sell to an investor (severe property condition issues or tenants on long term leases) will obtain higher values if they pay attention to “how they sell”.  In short, the way to get top dollar is to expose the property to the most available buyers.  If an investor is the only option as a buyer, creating competition amongst those investors will typically better protect value.  What most sellers don’t know is that those investors flooding your mailbox with “we will buy your home” offers – will also make offers to listed homes that meet their criteria.  That is good news for sellers wanting an investor offer as a good listing agent can attract multiple investors and make them compete on price and terms for the home.  Also a listing agent can help the seller understand the real costs behind the “you pay nothing” investor offers.  Anytime venture capitalists are spending millions funding “We buy homes” companies, you can be assured you are NOT receiving a “no cost” offer for your benefit.  Venture capitalists only spend money when they believe there is plenty of money to be made for them.  Who is paying them?  The often unsuspecting home owner is paying them in lost equity.

Don’t believe us?  Let us give you a real life example of an offer we received on one of our seller’s homes:

Opendoor used a team of local real estate professionals and a proprietary valuation model to determine their offer on your listing at 16947 Durango St:

  • Valuation: $230,000
  • Service charge, to cover holding costs and liability while finding a buyer: $17,250
  • Net offer price: $212,750
  • Opendoor cannot purchase this listing if it has the following features: unpermitted additions, leased solar panels, in a gated or age-restricted community

…. The net offer does not include the buyer’s agent commission.

Opendoor will have inspections performed by a licensed, independent home inspector and will submit a Repair Addendum like a traditional buyer…  

The service charge is 7.5% for the listing side, which does not include the buyer commission that must be paid (in this case 3%).  Those percentages are well above anything we charge in commissions.  This makes the claim “save on commissions” dubious at best. But you decide if this example looks like a “savings” as we listed and sold this very house for our seller.  Here is what happened when we placed it on the market:

Russell Shaw Sale

Sales price:  $234,900

Commission: 6% (3% + 3%)

Time on market: 20 days; 33 day close

Sales price vs. list price : full price

Repairs required to close:  4 minor repairs

vs.

Open Door

Sales price: $230,000

Commissions and/or holding costs – 7.5% + 3 % = 10.5%

Time to close: 14-60 days

Repair required to close:  unknown; “Open door will itemize the request repairs with their cost to have the repair completed and will provide the Seller a credit in-lieu of repairs option”

That resulted in 15K more in the seller’s pocket before Open Door’s “repair negotiation” which often results in additional reductions.  This is not to pick on Open Door (or any of their ilk such as Offer Pad, Iknock, etc.) but rather to point out that sellers will always net more on the open market – if their home is marketed to the most buyers possible.  If the goal is the most money, shouldn’t this be a last resort and not a first?

Russell & Wendy

(Mostly Wendy)

Where Buyer’s can Win

While sellers are gaining the upper hand in the marketplace this spring buying season, they don’t have power in all areas. Let’s evaluate where buyers are winning and losing. Relatively strong supplies (which give buyer’s potentially more bargaining power) currently exist in:compass

Chandler –supplies have been rising since early March and are about at the same level as last year

Fountain Hills – starting to fall but higher than any time since 2010

Gilbert – active listings are climbing in 2015 (although still below 2014)

Scottsdale – listings are slightly down from last year but still plentiful

Laveen – listings are up and at equivalent levels of 2012

Cave Creek & Paradise Valley – both areas have abundant supply and are hitting new highs for supplies

Gold Canyon- listings are more plentiful than last year

Where can buyers expect tough competition for homes? The west valley is particularly low in supply, largely because housing is most affordable there. Glendale, Tolleson, El Mirage are seeing multiple offers and stiff competition from buyers for homes. As demand is up in all areas, smart buyers will learn the dynamics of their particular shopping area to learn how to win.

Mixed Messages

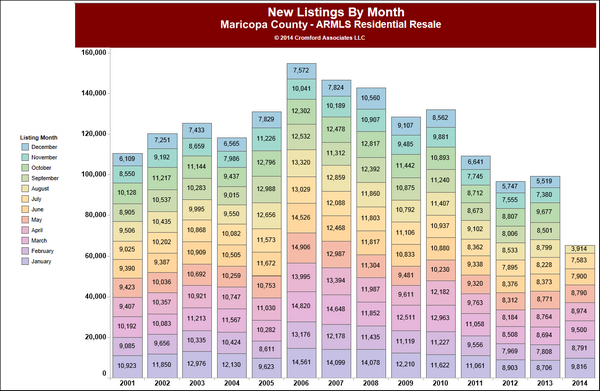
It is understandable that both Buyers and Sellers (and if we are completely honest, most real estate agents)  are scratching their heads as to cromford new listings by month for travis sept SMALLthe state of this market.  We have listened to the sides argue we are in a “buyer’s market”, no wait we are in a “seller’s market”!  The underlying fact is that the real estate market is a moving target.  This means that the market conditions are in flux – there is what the market condition is now and then there is the lag until people know where the market is.  If you haven’t fallen asleep at that concept, let us share some interesting facts:

  1. Active listings are down 14% since March of this year. If you’re a seller – low supply – that sounds like a seller’s market doesn’t it?       Of course, if we compare active listings now to this time last year, we are up 28% in supply. That sounds like a buyer’s market doesn’t it?       See how confusing this gets?
  2. Price appreciation for the last year came in at a paltry 1.9% (for non-distress sales). By the way, inflation is running around 1.9%. So essentially, houses have not really appreciated in the last year. The seeds of weakness in pricing started with the market shift that began in 3rd quarter of 2013. But as we stated before, there is what is happening and then when the market knows what is happening – which can cause a lag in price changes.       Indeed this is the case as the softness in pricing that began a year ago finally showed up in this year’s 3rd quarter. So that’s a buyer’s market right?
  3. New listings coming to market began the year up 9% over last year’s new listings. But again, as the market is a moving target, new listings suddenly dried up as the 3rd quarter began, coming in 10% less than the same time in 2013 and 8% less than in 2012. This is notable because in 2012 new listings to market hit the lowest levels since 2000 – a shocking and record breaking event.       Yet in the 3rd quarter we hit the lowest new listings to market ever for this time period.       So that’s a seller’s market right?
  4. Demand was grabbing all the headlines this year, as buyer demand cooled significantly. The causes were attributed to tougher lending guidelines, interest rates climbing, Millennials (i.e. first time home buyers) not buying, and investors going away. Interest rates seemed like a red herring – as when rates dropped there was no corresponding jump in demand. Millennials are in fact not buying. This has been attributed to “seeing their parents lose their homes in the distress market”. Hmmmm, maybe. Millennials seem to be delaying all traditional signposts of adulthood – marriage, children and housing – so it would seem to be a cultural change in commitment, not housing per se. It is certainly causing a boom in rental demand at the moment. Investor demand definitely shifted – going from 33.5% of the single family market purchases in 2012 to only 11.8% in 2014. So, no matter the cause, if buyer demand drops that’s a buyer’s market right?

So let’s try to answer that nagging question. The market is swinging slowly and surely back towards a balanced market primarily due to the weakest arrival of new listings in 14 years.   But, if that is the state of the overall market – it does not preclude the fact that the market is really a series of markets within a market.  Depending on price and location – some markets are definitely in a seller’s market and some are most definitely in a buyer’s market.  How can a consumer know the reality of their market?  At the risk of sounding self-serving you need the analysis of a competent real estate professional.  The study and accurate interpretation of supply and demand in the submarkets is the only way to truly understand your marketplace.  As always we are here to help.  Our thanks go to the one and only Michael Orr for his incredible Cromford Report statistics.

Why Selling in a Balanced Market is actually Good

One of the most common questions that would-be sellers ask us is when is the best time to sell? The questions vary but generally sound something like this: “Isn’t it best to sell in a seller’s market?” “Now that the market has shifted to a balanced/slight buyer’s market isn’t that a horrible time to sell?” Actually, if you have a choice (and often we have no choice – selling is often driven by circumstances not under our control) selling in a balanced market may be one of the best times to sell. Here are some of the reasons we believe sellers should consider this time to get their homes on the market:

1. Price appreciation flattens in a flat market. We know this sounds counter-intuitive but bear with us as we explain this. Prices are always a trailing indicator in housing. This means that anywhere from 9-18 months after something happens in the market – it is reflected in prices. The market started shifting away from a seller’s market in June 2013 when buyer demand began withering. Pricing runs on fumes for a while before evaporating. That “fume” stage is a sweet spot for sellers because prices are gently floating up, word is not really out on the street that the shift has occurred, and the big future price appreciation that sellers would miss out on if they sell in a seller’ s market – is not being missed. In other words, when prices go flat – sellers are selling at a peak.

2. In a balanced market, builders remain conservative, adding only a trickle of new homes. In a strong seller’s market, builders – just like any other seller – want to cash in on the strong appreciation. This starts adding more and more supply of homes – which as we observed in 2005 – and can create a bubble that “pops” when supply becomes glutted. As we have seen, recovery can be painful and slow after that pop.

3. In a strong sellers market, successful sellers become “homeless” when they are unable to find a home to buy. Sellers who are buying locally, enjoy the power a seller’s market provides them as a seller, but then find themselves stressed and panicked when trying to buy in that same market. This can lead to poor buying decisions and huge concessions to obtain a home.

4. Less problems with low appraisals. An often overlooked problem in a strong seller’s market is the financing piece. Lenders base all their numbers on the appraised value of a home. In a rising market, prices begin escalating over yesterday’s pricing. While sellers often get a higher than expected yield at point of contract, they can find themselves giving that money back to the buyer when the appraisal comes in low or risk the transaction cancelling.

5. In a balanced market there are still enough buyers around to still sell without great difficulty. A balanced market means just that -buyers and sellers are in equal supply. So although the “feeding frenzy” may not be present, the buyers are still viewing and buying properly marketed properties in sufficient quantity to make selling a relatively easy and fast process.

How long will our market stay balanced? That is the million dollar question. At the moment, we see nothing dramatically pulling the market one way or another . But as Sir Isaac Newton so brilliantly said “ I can calculate the motion of heavenly bodies, but not the madness of people.” As always, we will do our best to keep you informed on the Valley’s volatile housing market.