As 2017 reaches the halfway mark – the trends have solidified. Not surprisingly, supply continues to be constrained under 300K. Most severely 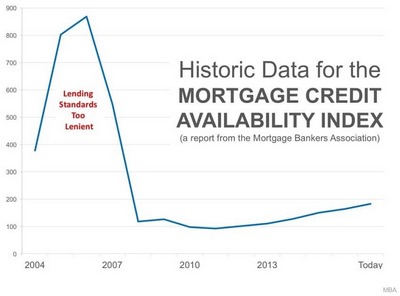 constrained is supply under 200K – in Maricopa & Pinal counties it is down a whopping 34% from this time last year. Appreciation is remaining strong. Demand has only recently showed a slight weakening – but so mild as to really have no effect at all. For those who prefer a market snapshot, that is about all you need to know. For those of you who prefer more nuanced detail, read on.
constrained is supply under 200K – in Maricopa & Pinal counties it is down a whopping 34% from this time last year. Appreciation is remaining strong. Demand has only recently showed a slight weakening – but so mild as to really have no effect at all. For those who prefer a market snapshot, that is about all you need to know. For those of you who prefer more nuanced detail, read on.Â
In analyzing the market, Michael Orr of the Cromford Report uses the Contract Ratio to determine how “hot” a market is. It specifically measures the number of completed sales contracts relative to the supply of active listings. According to the Cromford report, the under 300K price range has the strongest contract ratios since 2011. The 300K-400K range is not as hot as it was in 2013. 400K-600K is not at hot as 2012 & 2013; 600K-1 million is not as hot as 2012 & 2013; 1 million – 2 million the coolest year since 2011; over 2 million is the coolest year since 2012. To further quote him:
Â
“The contract ratio stands at 66.5 for the overall market, the highest number for the start of any month since August 2013. This number is convincing evidence of a hot market because in 2013, as in 2011 through 2012, the high contract ratios were amplified by the large number of short sales that hung around under contract for a long time without closing. These have disappeared to just a trickle today.
Â
So in summary almost the whole market is humming along with all cylinders firing. However there is little sign that it is going to move up a gear from here… We are at a point where the seller remains in firm control but the seller’s advantage is no longer growing stronger.
Â
Whether that brings any significant relief to buyers I very much doubt, because we are entering the period, from early May to early October, when active listing counts tends to fall back, leaving even less supply for them to choose from. In fact if they fall any faster than average that may completely counteract the slight fall in demand we are currently seeing.â€
Â
Given the strength most sellers have experienced and the appreciation rates of the last few years, we are starting to hear rumors that the “Phoenix market is almost back to 2006 pricing†or “we are experiencing another bubbleâ€. Both statements are false. Read that again, both statements are false. Analyzing exactly “how far†the valley has to go to get back to the peak of housing pricing is far more complex than most realize. Different parts of the valley peaked at different times, price points reacted differently and fell by differing percentages, and different types of housing (i.e. single family, townhouse, mobile homes) also had differing falls and rises. But in analyzing these factors, no one has better numbers than Michael Orr. As he explains:
Â
“…prices in Greater Phoenix still have a long way to go before they return to the peaks before the housing crash…
Â
It is very noteworthy that before the crash, condos & townhouses used to be cheaper than single-family homes on a $/SF basis, but that at present they are more expensive and are appreciating faster. As a result they have far less to go to get back to their peak level. Mobile homes have always been much more affordable than the other types, but they have recovered closer to their peak. They only have 16.7% to go and are currently appreciating faster than single family homes but not as quickly as condo/townhouse properties.
Â
We also note that homes over 3,000 have a huge way to go (almost 50%) before re-attaining their peak. They are also increasing in price the slowest, especially slow for homes between 4,000 and 5,000 sq. ft.
Â
In 2017, it appears, from an appreciation point of view, to be an advantage for a home to be closer to the center of the valley, smaller than 2,000 sq. ft., affordable and either attached or mobile. Large, expensive single-family homes on the outskirts are appreciating the slowest of all property types and have the furthest to go to re-attain the heights before the housing crash…
Â
Prices are not back to the peak 2006 levels and I am somewhat surprised to see claims elsewhere that this is not too far away for Greater Phoenix. We still have a long way to go for most parts of the valley, especially if we are measuring the monthly average price per square foot. The current average $/SF for all areas & types is $151.29. This would have to increase by 26% to get back to the May 2006 peak of $190.61.
Â
Those measuring monthly median sales prices do not have so far to go, but we are currently at $234,900 while the peak was $267,000 (attained on June 16, 2006). We need 14% appreciation to get back to the prior peak median sales price.â€
Â
So although we are not at peak pricing, we are at appropriate pricing respective to demand/supply. Real estate does very well at a 2-7% appreciation rate per year. The valley is no exception.