“This is now an exceptionally strong market with no sign at all of the weakness we were seeing between September and February.” Michael Orr of 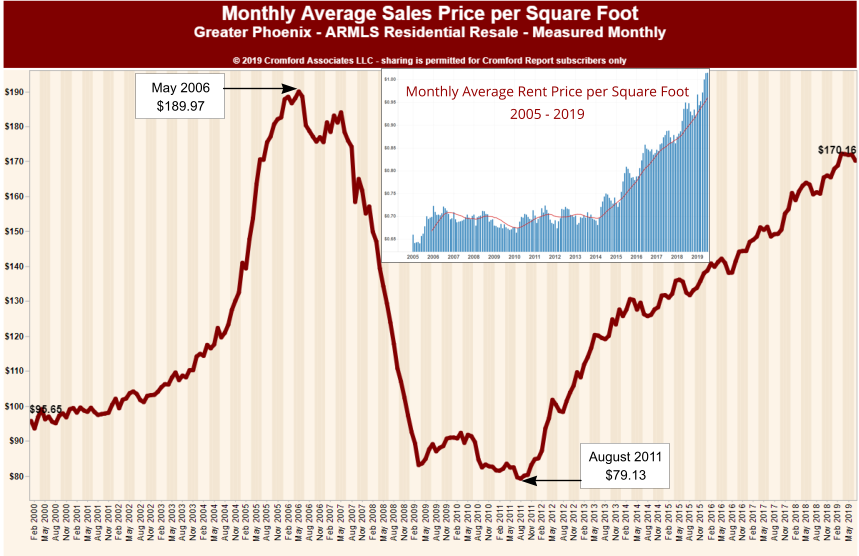 the Cromford Report
If you are someone who prefers headlines over articles, the above quote summarizes the valley’s current market. For those who prefer more details, read on.
We entered 2019 with sluggish demand that had taken root in the final quarter of 2018. All signs and numbers supported the fact that we were headed for a balanced market. That is until March of 2019 when demand awoke and began reversing trends with vengeance. So what is driving this demand? We can only speculate but there are certainly some likely suspects.
Interest rates Interest can impact the market as they directly affect affordability. By November of 2018 Interest rates hit an average 30-year mortgage high of 4.94%. Fast forward to March and rates had come down almost 1%. As of this writing they are in the 3.75% range. That increases buyer’s buying power considerably and certainly seems to be fueling this demand.
Rental rates When it is cheaper to buy than to rent, the first time home buyer market jumps. This is incredibly impactful as the first time buyer drives the housing market – creating a domino effect allowing for their home seller to in turn purchase their next move up home, and so on with an average chain of seven sales. It is easy for headlines to skip the rental market and focus solely on the resale market but the valley’s rental market is noteworthy. To quote the Cromford Report:
“In June, the average monthly rent per sq. ft. was $1.01 for listings closed through ARMLS. This [is] the first time we have recorded a figure over $1.
In June 2006 the average monthly rent was only 71 cents per sq. ft., so rents have increased by 42% since then. In comparison the average purchase price per sq. ft. has moved from $188.53 to $172.02 since June 2006, a fall of 9%.So average rent has increased 42% while purchase prices have fallen 9% since June 2006 on a cost per sq. ft. basis.”
Job market The valley‘s long term job creation averages around 40,000-50,000 new jobs yearly. However 2018 saw a jump in new jobs to 86,800 according to labor statistics. In fact only Orlando had greater job growth in 2018. Jobs bring people and people need housing. Simple.
Affordability We may get eye rolls with arguing for affordability in a market that has seen such a strong recovery in pricing and appreciation since 2011. But it is worthy to note that Phoenix is the 5th most populous city in the country. Our median sales price of $279,000 is unheard of in cities of our size.
What about supply? We would be remiss to not comment on the other half of the supply/demand equation. Supply hasn’t been abundant for years, so it is easy to dismiss low supply and focus solely on volatile demand. But factually, June was notable for the low numbers of sellers coming to market. As Michael Orr of the Cromford Report shares (emphasis added):
“The most unusual change during June was the 8.5% drop in active listings … which lurched from 5.3% higher than 2018 on June 1 to 4.1% below 2018 on July 1. Much of this decline was due to the low number of listings activated during June – 8,731 is our current count, the second lowest number for June since 2001 and down 11% from June 2018. On top of a very busy month for contracts and closings this has caused the supply to tighten dramatically….This is the greatest imbalance in favor of sellers that we have seen in almost 6 years.
Not surprisingly this is pushing up pricing. As the Cromford Report further reports:
…The monthly median sales price of $279,000 is a new record high. The annual median sales price is also at a new record high at $268,000.
But before you celebrate (or begin having sleepless nights over another “bubble” in housing) there is a secondary set of numbers that typically are more accurate on tracking value. Read on…
Average price per sq. ft. is nowhere near setting a new record, because the homes being sold today are much larger than those being sold at the last peak. The monthly average $/SF record is $190.05 set in May 2006. We edged up very slightly to $172.30 from $172.01 during June.
There are no indications we are in a bubble. Rather, we simply have a very strong sellers’ market underway. Will it last? History says no. Supply and demand are a seesaw that affect each other. Short supply causes prices to rise. As prices rise, demand tends to falter allowing for a rebalancing of supply. The question is when. As always, we will continue to report the market trends as they unfold.
Russell & Wendy Shaw
(mostly Wendy)