As we enter the last quarter of the year, we begin reflecting on how 2016 has compared to 2015. It has been a remarkably similar year to 2015 – with only some minor variations.
The biggest challenge of the 2016 market has been the intensely low inventory in the $175,000 and under market. The situation began in earnest in 2015 and has only accelerated. Any buyer shopping in the $100,000-$125,000 price point for single family properties can share their own tale of misery – as the inventory in that range has nearly evaporated. As we have mentioned in articles past, supply is the harder side of the equation to move – demand being far more mercurial. Unless we get some institutional owners (hedge firms, investors, etc.) to part with their rental inventory – we see no immediate solution to our entry level, single family home supply issue. As in years past, buyers in that price range are currently faced with only a few options: remain a tenant, increase their buying power (i.e. cosigners or increased down payment/income) purchase a condo, purchase a mobile home, or go out of demand areas to lower priced housing.
Demand has also improved over 2015 – but not dramatically (frankly, we are not unhappy about avoiding “dramatic†trends after the rocket ride of the last 10 years). As our guru, Michael Orr of the Cromford Report opines:
“We are now at the point where inventory hits its minimum level in most years. New listings are arriving only 3% faster than last year and we have seen quite a lot of cancellations, especially at the higher price points. We will be looking to see what sort of inventory growth we get between now and the next peak at the end of November.
Demand is currently holding up, some 5% higher than we would consider normal. However the market conditions are probably going to be determined by changes in the supply.“
We have begun to see the occasional headline warning of an impending drop in demand. Let us offer some thoughts on the matter. First, supply and demand are a balancing scale – meaning that when demand exceeds supply – prices go up. Prices going up, cool off demand. Cooling demand increases supply. In other words, this is exactly what is supposed to happen – supply and demand move up and down in a balancing act. Additionally, our market has uniquely segmented behavior specific to price ranges, rather than the more traditional geographic segments. Demand has already fallen in the high end – attributed perhaps to an aging population who are downsizing, the stock market, and hot temperatures (buyers with funds flee the valley in the summer).   The mid- range market has been mostly flat, and the low end has been appreciating due to the low levels of supply. Most importantly, real estate markets are local – not national. So any broad statement about “the real estate market†should be met with some skepticism. Here is Michael Orr’s brilliant analysis of our market place:
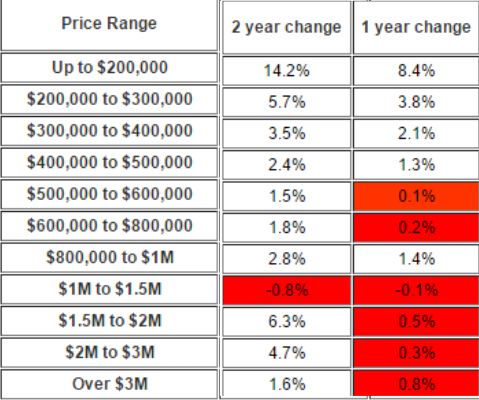
“In the recent couple of years the market trends have been determined far more by price range rather than the traditional location (location, location). This is contrary to normal market behavior. We are not used to our fastest appreciating markets being those with the worst performing schools and the highest rates of crime. However a few numbers will easily prove my point: The figures below are for all property types within Greater Phoenix.
I highlighted in red the price ranges which went backwards in dollars adjusted for inflation (which was 1.01% this year and 0.12% 12 months ago).
I am not sure why the $800,000 to $1M range should be doing better than those either side of it. It is faring as well as the $400,000 to $500,000 range. The rest of the ranges from $500,000 upwards have not performed so well over the past 24 months. The range between $1M and $1.5M shows the weakest trend here.Â
In terms of unit sales through ARMLS, the price ranges at or below $500,000 comprise 93% of the total market while those above $500,000 comprise only 7%. So it is fair to say that the market as a whole is keeping housing assets appreciating well ahead of inflation. This becomes even more true as you head down market.
The picture changes when we look at supply rather than demand. Among the active listings on ARMLS within Greater Phoenix today, listings over $500,000 comprise 24%, and those of $500,000 or less only 76%.â€
If there ever was a case for avoiding Zillow’s erroneous zestimates, the above would prove the point. Markets are nuanced, and there is no substitute for looking. As always, we will do our best to keep you informed on the real trends in our marketplace.