Some very interesting stat comparisons courtesy of Mike Orr at the Cromford Report.
Next you can see the Average Annual Price Per Square Foot – based on area:

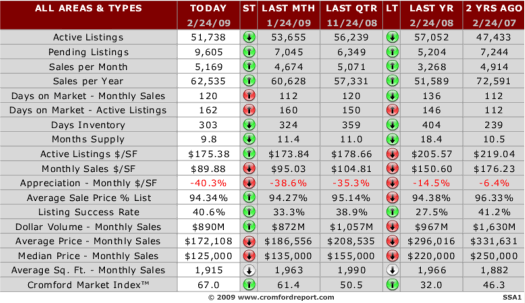
And finally a "market snapshot" that illustrates some interesting comparisons.
a housing market blog site from russell shaw of realty one group
Some very interesting stat comparisons courtesy of Mike Orr at the Cromford Report.
Next you can see the Average Annual Price Per Square Foot – based on area:
And finally a "market snapshot" that illustrates some interesting comparisons.
Let me start this post by publicly acknowledging and thanking Jim Sexton, Designated Broker for John Hall & Associates, for his brilliant research (which you are about to see). I am going to comment on and link to several charts. In some cases I will show a small version of the chart in this post and in every instance I will provide a direct link to a full-size version of the chart.
What happened to the housing market in 2008 is quite unlike anything we have ever seen before. Starting in January of 2006, same month sales started coming in lower than the same month the year before. Our boom was over. Looking at number of homes sold, for 29 consecutive months we sold less and less and less. January of 2006 was less than 2007, January 2008 was even lower, etc. For 29 months this continued. Then in June of last year that trend started to reverse. From June 2008 onward we started selling more homes. For the last half of the year, sales each month were greater than that month the previous year. Here you can see Home Sales Per Month for past four years and here you can see Home Sales Per Quarter and Half. It is in this 2nd chart that what happened starts to become visible.
More houses were sold in 2008 than in 2007. But all of that upswing happened between June and December. Sales were actually much lower in the first half of 2008. But look what happened to prices!
Here is a larger version of the chart so you can look. From the 4th quarter of 2007 all the way through 2008 the median price declined every month. Every month.
Most analysts easily see the decline in the median price from 2006 – 2008. It is yip-yapped about in the media almost non-stop. But I don’t know of any (unless they just recently copied this research of Jim’s) who saw the decline throughout the year. The median price for the year was 190k. In January it stood at 220k but by December was 144k.
Please understand that – contrary to almost all economists “thinking” on this subject – median prices are not a reliable tool to track short-term price movement. That is not what I am reporting here. Median prices tell us what is selling (median price is the middle point, half of the sales are for more, half are for less). In this case, foreclosures and lender owned properties. Lots of them. Average Prices suffered a similar fate. Here is a look at how average prices breakdown and compare for the 1st and 2nd half of the year.
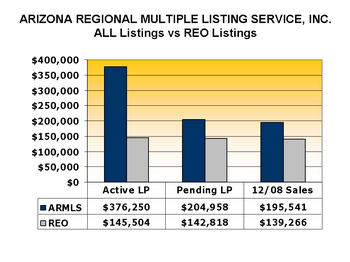
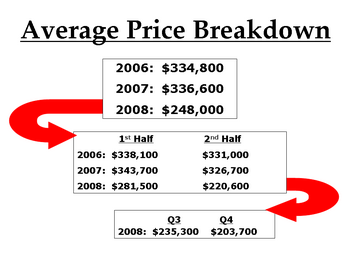 You can see a larger version of the Average Price Breakdown here. Like me, you may be seeing a trend here. Sales prices are sliding. Rapidly. Normally, in any market, sliding prices would be accompanied by falling sales. But here we have the exact opposite happening. Home sales are booming. Well …. some home sales are booming. Lender owned homes, or REO (Real Estate Owned) homes are selling and driving the prices for the entire marketplace. Here you can see the relationship (and the current trend) between REO, open market listings and short sales. The policy Arizona Regional Multiple Listing Service (ARMLS) had for indicating a Short Sale changed, so accurate data isn’t available for the entire year. But let’s take a few facts that we do know: 34% of all valley home sales in 2008 were owned by lenders. However, look at the trend: by December it was up to 52%.
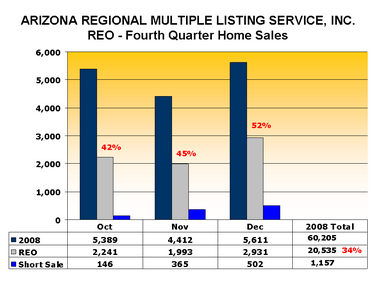 See a larger version of that one here. 24% of all MLS listings are REO. But over half of all the sales are REO. The Pending Sales have an even higher percent of bank owned.
Why?
Short answer, price. Look at the difference in asking prices vs. pending prices vs. sold prices. Notice how the REO numbers are about the same in all three categories. Contrast that to asking price vs. sold prices for all the other listings.
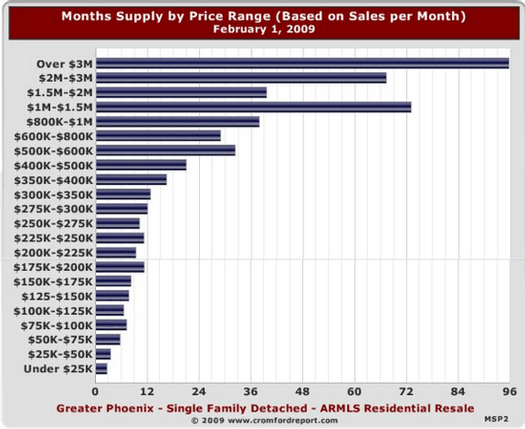
What does this mean to you? If you are a buyer, affordability is back. This is the best news you have had in years. The very best. Interest rates are at historical lows and prices are way down. It has been a long long time since buyers have anything like this – if you are moving here from out of the area or buying your first home, welcome to Home Buying Heaven. Interestingly, if you are selling and buying a larger or more expensive home – I will say the very same thing to you. The extreme downward price pressure is not at all at the lower end – it is the higher priced homes that are taking the big price beating. If you have a higher priced home (right now that is probably anything much above 400k) nothing I am writing here is good news. It only works well for you if you are selling and moving up. If you are in the category of selling a high end home and not replacing it, right now isn’t a very good time for you to sell. Not trying to be negative here but wanting to treat you like I would personally like to be treated: give me all the relevant facts.
For everyone else, this isn’t simply good news, it is nothing short of fantastic. I hope you can take full advantage of this golden opportunity.
Single Family Home Sales Year to Year Comparison by Price Range. When comparing single family homes sales by price range for October 2007 to October 2008, homes sales have boomed in the under $200,000 price range. Home sales in every other category have declined.
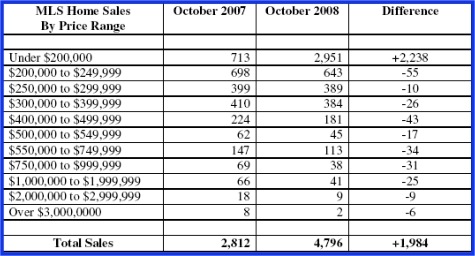
Special thanks to Fletcher Wilcox of Grand Canyon Title Agency for the data.
Your house as seen by:

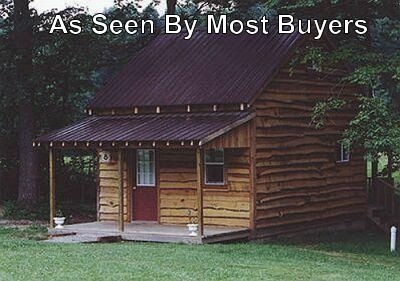
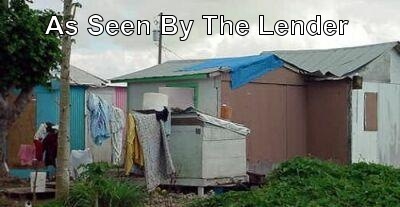

Just kidding. Really. But I hope you enjoyed seeing it. 🙂
Our grandparents and their grandparents have all seen this movie before. It only seems new.

Thanks to Benn Rosales of AgentGenius for finding this jewel.
And yet the earth continues to spin on it’s axis. Perhaps we will survive even this? 🙂


The emotion of fear is a gradient scale that starts at simple, garden variety “worry”, at the lowest level and goes up to a high level of terror. At the highest levels of fear the body will literally shut down. The emotion of fear is built-in to the body from a long time back as a survival mechanism (the fight-or-flight response). If you have a mental fear the body will respond. Any real or imagined threat to survival can produce this response. However, possibly having less money (which is a survival point in the current society) is not likely to cause death. But many people will get a mental and physical reaction to being laid off, fired or receiving less money that is not much different than if life itself was about to end.
If there was ever a question about stock market prices ever being based on anything other than greed and fear that question had to have been answered in the past two days. Oh-my-god-congress-didn’t-pass-the-bailout-bill-sell-everything. Good-news-it-looks-like-they-will-work-it-out-my-stock-is-valuable-again.
Good grief.
This isn’t the end. The four horseman are not mounted and riding – I make that statement fully realizing that folks wearing suits who are on TV or work for the Federal Government are saying this is the worst possible situation. Blah, blah, blah. In case you missed it over at Bloodhoundblog, see this for a good laugh.
This is only about money. Money that was spent by people who didn’t earn it and who didn’t have it. One of the primary laws of finance is that income must be greater than outgo. Sounds simple. So simple it is routinely ignored: by individuals, companies and governments. The United States is the richest, most powerful nation on the face of the earth. More so than any nation has ever been in all of recorded history – even Rome, when all roads lead there. And yet, our country – with all of it’s riches and all of it’s resources has been spending more than it has been earning. The current “meltdown” is just the house of cards that was there all along, falling down. You can’t lose what you didn’t have. We haven’t “lost something” so much as we discovered we didn’t have something. To paraphrase Winston Churchill’s statement on democracy, the bailout is the worst possible solution, except for all the others.
Some say if we don’t do the bailout we could have a depression. Not a recession, a depression. Truth is we could have a giant recession or even a depression if we do the bailout. And I’m writing this to make you feel better. It is just money. That’s all, money. No matter what happens, it isn’t the end of life as we know it. You want to survive. Me too. A simple way to accurately predict how a person will behave or fare in the future is to look at their past pattern. How did they do before? How do they tend to handle things? Do they tend to screw things up no matter what? Or do they tend to land on their feet – always finding some way to make things go right? That is always the ultimate test of any being: The ability to MAKE things go right. Not “are things right? The ability to make them right. Don’t you usually so just that? So what makes this all that different? The suits from the government and TV yip yapping about this mess like they know what they are talking about? If they knew what they are talking about we wouldn’t have this mess.
No no. It isn’t that I have faith in the people “fixing” this – it is that I have real faith and confidence in man’s survival drive – your survival drive. Something really bad? September 11th, 2001, New York City. Yet, here we are. If you insist on having something awful to worry about at least have the good sense to move it off of the subject of money. Money does not equal life. Worry about (I’m not really wanting you to do this!) World War III. This small little planet is composed of an anarchy of nations armed with nuclear warheads. Potential mid-east conflicts alone could bring about the end of life as we know it. If you must concentrate on “something awful” – use that one. But let me suggest, if you have managed to make it through the past few weeks without losing sleep over that one – skip the bailout, as well.
The question, what turns your dial isn’t nearly as important as who. Who turns your dial? And hopefully, the answer to that question – at least most of the time – is you.
| Most Expensive | 2008 Avg. Sales Price | Most Affordable |
2008 Avg. Sales Price |
||
| 1 | La Jolla, CA | $1,841,667 | Sioux City, IA | $133,459 | |
| 2 | Greenwich, CT | $1,787,000 | Jackson, MI | $134,325 | |
| 3 | Beverly Hills, CA | $1,777,475 | Akron, OH | $135,780 | |
| 4 | Palo Alto, CA | $1,740,333 | Canton, OH | $139,667 | |
| 5 | Santa Monica, CA | $1,653,333 | Grayling, MI | $141,000 | |
| 6 | Santa Barbara, CA | $1,599,667 | Minot, ND | $142,000 | |
| 7 | Newport Beach, CA | $1,546,250 | Arlington, TX | $143,775 | |
| 8 | San Francisco, CA | $1,513,181 | Muncie, IN | $144,250 | |
| 9 | Boston, MA | $1,493,750 | Killeen, TX | $145,812 | |
| 10 | San Mateo, CA | $1,366,475 | Eau Claire, WI | $147,300 |
One of the most interesting and useful comparisons for national home prices is no doubt the annual Coldwell Banker Home Price Comparison Index. It isn’t the average or median price in these cities: this one provides an apples-to-apples comparison of similar 2,200 square foot, four-bedroom, two-and-a-half bath homes in 315 markets across the United States, plus other areas and countries.
Remember, all of the prices you are looking at here are for similar homes – the only real variation being location. A similar home in La Jolla ($887 a square foot) costs almost fourteen times as much as one in Sioux City, Iowa ($60 a foot). Wow. It looks like it is: Location, location, location.
Here is a link to an article showing various tables and graphs from Market Watch.
Would you be better off if you waited a bit for the market to “hit bottom”? Or is now is now a good time to buy?
It depends.
It depends on several factors: do you need a home now? Can you comfortably wait? How you will know the bottom happened? What if interest rates went up as prices were at their very lowest?
There are so many economists (and other people who also don’t know) making specific predictions on what is going to happen and when, that one thing is obvious: they can’t all be right. Most of them don’t agree even on how they define, “bottom”. I would add the obvious fact that not one “professional predictor” ever predicted the run UP in prices back in 2005. Not one. Not one single economist predicted the run up in prices – it was only after it was happening that they all started “explaining things”. It is for this reason alone that I tend to ignore most of their predictions now. They don’t know.
What is known is that the absolute bottom on prices can only be known for sure 4 to 5 months after the fact. It isn’t possible to be certain at the time. Will some people manage to have actually hit precisely the bottom? Yes. But if they claim to have done it intentionally it is a pretty safe bet that they are knowingly lying or are running on pretended knowingness – as it is very unlikely to causatively “time the market”.
Some think the absolute bottom is 6 months from now. Some investors think it has already occurred. What I know is that the biggest winners of this market in years to come will be the ones who bought while they could in the “window of opportunity”.
xxxxxxxxxxx
If you are a buyer the correct answer (simple version) is the one that gives you the most bang for your buck. Based on what you wanted and needed (location, school district, price range, number of bedrooms, number of covered parking spaces, etc.) You would first sit down and figure out what was it you needed (that you could afford). Then you go shopping. You want to only look at those homes that meet your specifications with regard to price range, and that have all (or at least a majority) of the features you really have to have.
There are few “perfect homes” and there are usually going to be concessions. Few get everything they wanted. But most won’t settle unless they get most of what they wanted. In this market they don’t have to. So the buyer goes shopping and looking over the relevant properties in the area they want to live in they pick the one that gives them (when compared to all the others they could have purchased) the nicest house for the least amount of money.
This is the system in use by home buyers today. It was the same system used by home buyers when I entered the business in 1978. I suspect it was the same system in use in 1958, as well. I am very confident it will still be the one used in 2058. Which one gives me the most for the least?
______
If you are a home seller you have a huge advantage over the athletes who compete in the Olympics: you don’t have to beat out every other home seller around in order for you to completely win. All you have to do is to know (or hire someone who does) where the “water line” currently is for a house like yours. Fishing with your bait out of water makes little sense, just as pricing your home so low that you wind up leaving money on the table that could have been yours.
No house is the “right house” for everyone. But any house – properly priced and properly marketed – can be the right house for someone.