Mid-year Report

As we hit the mid-way point for 2011 the trend that began as a trickle in the beginning of the year seems to be established. The cliff note version is as follows:

• Supply continues to decline and demand remains at a high level almost everywhere.
• Having hit bottom in January, average price per square foot is now moving higher.
• Buyers are active at all price levels, and multiple offers are returning to the market.
• Pending foreclosure counts are dropping at an accelerating rate.

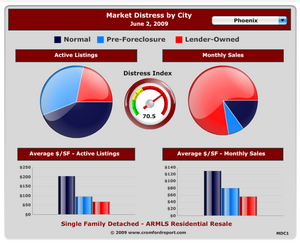
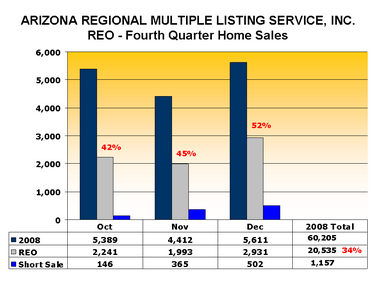
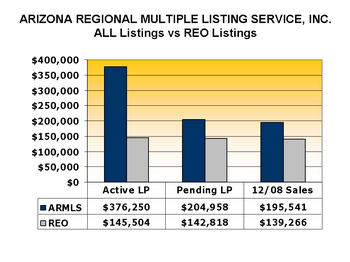
For those who want more detail, read on. The overall price per square foot inched up by 2.93%. How did that happen? The simple answer is that normal sales gained market share, moving from 34.2% to 35.9% of sales, while foreclosed homes lost market share (always a good sign). Foreclosed homes dropped in market share moving from 46.9% to 44.2%. Short sale and pre-foreclosures also gained market share moving from 18.9% to 19.9%. Generally, increased market share in the normal sales and short sales and away from foreclosures, result in a higher price per square foot. The one opinion all experts share is that foreclosures have an extremely negative impact on home prices.

New notices of foreclosures are dropping rapidly. April’s figure is looking lower than anytime since 2007. Wow, that is something we have waited a long time to say. The actual trustee sales also are down, which combined with the lowered new notices is helping drop the inventory of pending foreclosures. Anyone looking for foreclosure bargains will be sadly disappointed soon with the lack of inventory. Supply is falling at a fast rate and in fact supply levels have not been this low since January 2006. If this trend continues, we expect to see even more multiple offers and bidding wars over the dwindling supply of all homes, not just distressed homes.

Another interesting trend is that investors are buying more than ever at the courthouse steps. A record 30% of the homes being auctioned off were sold to investors in April. As a comparison, when foreclosures really began their climb in April 2008, 95% of all foreclosures reverted to the lender. As these foreclosures continue to dwindle, look for pricing to continue to struggle upwards. As we mentioned so many times, price is a trailing indicator – meaning that supply/demand imbalances occur first, with pricing to follow.

Here are the positive trends:

• Economy and jobs are improving slowly
• Homes supply has been declining fast since November
• Low prices are stimulating stronger demand for homes – intense low-end demand primarily from investors; Affluent buyers are returning to the luxury market
• Foreclosure notices are now declined to late 2007 levels

Here are some negative trends:

• Strong shift from ownership to rental occupancy
• Financing still remains a challenge for owner occupants (41% of purchse are all cash; another 22% have more than 10% down)
• Arizona population has declined since 1st quarter of 2009

Short term, the trends appear to be that pricing is moving upwards, demand is outpacing supply, rental supply and demand are in balance. Long term trends remain elusive as economic recovery must continue and the dreaded “option arm resets” that were to peak in 2011 bringing a wave of foreclosures with them must be responsibly resolved by the banks and the homeowners.

A word of warning, expect to see a report from Case-Shiller explaining that housing prices are falling. That’s right, just the opposite of what you see here. The missing information on the Case-Shiller index is one thing: time. Case-Shiller is 6 months after the fact. That means that any current information is actually speaking of what was occurring last November, not mid-year. So, you have been warned.

The best trend of all from our perspective is bitterly acquired success of the short sale. Apparently after just 3 short years, the banks finally have gotten some systems in place for dealing with short sales. Further, the banks are once again postponing trustee sales for sellers who are truly working in cooperation with the banks to sell their homes through a short sale. Compared to the foreclosure-fest of August 2010, these indeed appear to be halcyon days. One year after HAFA (the government pre-approval program for short sales which pays up to 3K to sellers completing a short sale) was implemented; the banks actually are doing the program. This allows sellers to retain some dignity and cash in the elimination of their over-encumbered homes.

So there is the current market of the moment. As always, we thank Mike Orr and Tom Ruff of The Cromford Report for their exhaustive research. Our hope is that the W shaped recovery is underway for real and that we have begun our true climb out of this housing hole.

Russell & Wendy Shaw

Foreclosure Frenzy

Prior to 2007, home foreclosures played little to no role in the local real estate market. In fact only agents of our advanced years recalled the late 80’s, when the Savings and Loans went under and the resulting foreclosures flooded the market. History has a way of repeating itself and so it was in August of 2007 when the “Mortgage Meltdown” occurred, resulting in the return of the foreclosed home. What began primarily in the outlying communities (the “drive until you qualify communities”) spread rapidly until no neighborhood remained untouched. So pandemic was this wave of foreclosures that it quickly became our “new normal”. The danger of this kind of normalcy is that, well, it isn’t normal. Eventually, given enough time, the number of foreclosures will drop until they no longer are a factor in the marketplace. In short, at some point all the foreclosures will have happened – it is not an inexhaustible supply.

In fact, from January of 2006 through March 2011, Maricopa County has recorded 167,621 Trustee sales. Of those sales, 138,235 have been single family residences. To put this in perspective, there are 1,009,755 single family residences in Maricopa County. 13.7% of single family homes have been through a trustee sale. The zip code with the lowest percent of foreclosures is Sun City West with only 1.3%. The highest percent of foreclosures is 35% in the Phoenix zip code of 85043. For those of you who would like to see the breakdown of foreclosures by zip code, click here. Our thanks again to Michael Orr of the Cromford report for these statistics.

Sales Update

On a cheerier subject, real estate sales in the valley continued their strong pace. For only the fourth time ever in a month, residential sales were over 10,000 this March. For perspective, the three other months of sales over 10,000 were: June 2004, June 2005 and August 2005.

Single family detached homes consisted of 8,350 or 84% of the 10,000 sales. Seventy-seven percent of all single family sales were under $200,000. There were 862 single family sales under $50,000 and a whopping 90% of those were purchased with cash.

When combining all residential sales, 43% were lender-owned sales (REOs), 19% were short sales and 38% categorized were neither a short sale nor a lender-owned sale, though many of sales in the other category were recent lender-owned sales that were fixed and flipped.

Not surprisingly due to the high rate of displaced homesellers, the single family rental market remained hot with only a 1.5 month supply of single family rentals in Greater Phoenix.

Trends

Looking at the numbers and the implication for the immediate future, Michael Orr had this to say:
“With the balance between supply and demand changing quite quickly for the better over the last four months, we are down to an overall inventory level of 4.2 months based on the monthly sales rate. This can be regarded as a “normal” reading for the time of year (it is below the 4.5 we measured in 2002 at the same point in our last “normal” year). This goes a long way towards explaining why prices have stabilized once again.
Currently the trend is for supply to fall further and demand to increase, and if this continues then at some point it is likely to lead to prices moving higher. How soon and how much, it is too early to say. However it is not too early to say that prices are unlikely to fall to any significant degree while this situation persists. Last year the disappearance of the tax credit at the end of April caused the market to deteriorate suddenly in May and pricing fell sharply between July and September. At the moment we see no indication of a similar interruption to the recovery process that is now under way.”
Recovery! What a long awaited concept. We welcome it.

Russell & Wendy Shaw

Let’s Actually LOOK at Our Market

Any statistic is only valuable if it has been properly evaluated.  A tremendous amount of “information” gets printed and repeated.  Much of it is false or just plain silly.  Various economists make predictions about “the recovery” of the real estate market.  What is the definition of “the recovery”?  What exactly would one see if it “had recovered”?

RANK YEAR MLS UNITS SOLD EQUITY SELLER REO  CASH
           
# 1 2005 104,133 99% 0.42% 12%
# 2 2004 98,294 98.4% 1.66% 13.5%
# 3 2009 91,757 30% 56.00% 37%
# 4 2010 90,408 37% 41.30% 42%
# 5 2003 79,512 98% 1.99% 13.5%
# 6 2006 74,105 99% 0.18% 9.2%
# 7 2002 68,411 98% 1.65% 14%
# 8 2001 62,523 98.7% 1.30% 16.5%
# 9 2008 59,220 64% 34.50% 21%
# 10 2007 54,231 96.7% 3.30% 11.6%

On the chart you see here note that the highest sales year in history was 2005.  The second best year ever was 2004.  Take just a moment to observe that last year, 2010 was the fourth best year ever for number of homes sold.  Also, notice the relative number of sales starting with the record breaking number of 79,512 homes sold in 2003.  Look at how last year (90,408 closed sales in the MLS) compares to the other top years.

So, what is different or “bad” about our current market?  Well I suppose it would depend on who you ask.  If you ask the hoards of investors currently paying cash what is “bad” you would get a very different answer than if you asked a home seller (a whopping 42% of all sales in 2010 were cash buyers, mostly buying bank foreclosures).  What is good or bad is “price”.  What you see on the chart is that the REO (Real Estate Owned – commonly called foreclosures) category just a few short years ago was almost non-existent and last year the bank owned houses composed 42% of all the sales (that number for 2009 was even higher, 56% for the year).  When the percentage of cash sales rises way above 12 – 14% there is a reason:  heavy investor buying.  Currently investors are a huge component of our market due to the current low prices.

Notice that we now have a category called “Equity Seller”.  Just a few short years ago, these people were just called “sellers”.  The category “short sales” so recently entered our MLS data that we have eliminated it as a category – although it would tend to mirror the REO pattern.

Here are some interesting points on the market from the Cromford Report: “Segmenting by price range we still see the greatest weakness below $100,000 where supply is very high and additional REO supply may be looming as trustees process the backlog from Bank of America’s hiatus last quarter.  Even here the situation is much improved because buying activity has accelerated as the pricing has fallen.  The strongest price range is currently $400,000 to $800,000 where sales prices have stabilized and even moved very slightly higher over the last four months when measured by price per sq.ft.”

After unusually low foreclosure numbers in November and December (due to seasonal moratoriums and Bank of America’s temporary halting of foreclosures) the numbers reverted back to normal levels with 6,783 new notices and 4,585 trustee deeds recorded.  The net effect was to reduce the number of pending foreclosures to fewer than 40,000 for the first time since March 2009.

Add in to the mix of all this, the government’s proposal to eliminate Fannie Mae and Freddie Mac – or at a minimum move it back to the private sector.  This is a bit like locking the barn door after the horse has bolted – but change is warranted and inevitable.  Whatever the change, it will no doubt result in a rise in interest rates as less money is available for lending.  Rising rates impact affordability and could create downward pressure on pricing.  Our hopes are that the change will be implemented gradually to minimize the damage and allow the private sector to fill the gap left by these lending giants.

As always this market continues to provide plenty of topics for the water cooler.  We will continue to share the trends as they appear.  Please call us with your thoughts or concerns.  We are here to help.

Russell & Wendy Shaw

Market Trends

It is with some fascination that we continue to watch the local real estate market as it continues its predictable pattern for unpredictability.  Forecasting has been largely abandoned, replaced by tracking the immediate history.  So where do we stand today (for those who simply want us to bottom line the market conditions, skip to the end of this article).

The market hit bottom in April 2009 (at least in the under 250K range).  From that point, speculation was raised of whether the worst was over or if in fact a “double dip” was in the offing. The market began a slight recovery phase with the first time homebuyer tax credit – which stimulated the demand for real estate through mid-2010 and made great headway in consuming the over supply that had so badly harmed pricing. Pricing began to firm and we pondered if the first leg of recovery had begun or not. Some 20 months later after the “bottom” was established, the double dip has arrived.  But as is consistent with our market for the last few years, it presents some interesting dynamics (some might say schizophrenic).

For the monthly period ending January 15, the price per square foot averaged $82.16 per square foot for all areas and types – down 1.3% from $83.20 on December 16.  Pending sales price per square foot seems to suggest further drops in sales prices ahead.

It is clear that we have now fallen below the April 2009 levels and overall prices are trending lower still. However the detailed picture is more complex than appears at first sight.

First, pricing for normal sales (not short sales or foreclosures) has actually strengthened over the last three months, from an average of $106 per sq. ft. in October to around $112 in January.  You read that correctly, normal sales have strengthened slightly.  While this would appear to be a cause for celebration, this improvement in normal sales pricing has little effect on the overall average because normal sales only constitute 28.4% of sales.

Short sales, not surprisingly after the foreclosure festival held by the lenders this summer, currently compose only 21.1% of the closings.  The lion’s share of the closings (and gaining) is the REO properties (bank foreclosures).  The pricing of short sales and foreclosures has been particularly weak in the last six weeks, falling from $82.78 on November 30th to $77.45 on January 16th. That’s a 6.4% drop in just 7 weeks and is the primary cause of the overall fall in prices. Sales pricing for REOs has remained virtually unchanged at $63.70 over the same 7 weeks, but this also negatively affects the averages because REO market share has increased from 47.6% to 50.4% in the same period. Increased market share of foreclosures rarely bodes well for pricing.

Price behavior also varies by dwelling type. Over the last six months we see the following:

Monthly Average $/SF for: July 16, 2010 Jan 16, 2011 Change
Single Family – Detached $89.98 $81.85 -9.0%
Apartment Style / Flat $94.69 $88.94 -6.1%
Townhouse $80.72 $73.26 -9.2%
Gemini / Twin $69.05 $65.74 -4.8%
Patio Home $121.47 $102.21 -15.9%
Mobile / Manufactured $34.99 $33.66 -3.8%


So we see a less than cheery picture for sales pricing and no sign of any improvement in the next four to six weeks. In fact we see continued deterioration. But we are not overly concerned about this since sales pricing is a trailing indicator of the market and is the last thing to reflect any turnaround. When we look at other measurements things are not so gloomy. This is because lower pricing results in increased demand which is certainly making its presence known at the moment.

In short, prices are down, activity is up.  The current monthly sales rate and the number of pending listings are both very strong for this time of year, while active listings have declined over the last two months. All of these signs suggest a strengthening market. This gathering strength is still unlikely to be reflected in sales prices for several months, but it does look as though the spring buying season will be very busy in 2011. It will take more than one spring season to generate a market recovery. However it does mean that the downward pressure on pricing is starting to ease.

So 2011 is off to a bumpy but busy start.  Our thanks to Mike Orr of the Cromford report for the numbers and inspiration for this article.  As always, we will continue to track the market and share our findings with you. 

 Russell & Wendy Shaw

Milestones Charter School is holding their 2nd Annual Holiday Craft Fair & Bazaar

Phoenix: On Saturday, November 6th, Milestones Charter School is holding their 2nd Annual Holiday Craft Fair & Bazaar, while their neighbor, New Vision Center for Spiritual Living is holding their Annual Pet Blessing and Adoption Fair.

The Bazaar will be held from 9:00 am to 1:00 pm and will feature dozens of vendors offering unique holiday gifts, from handbags to wearable art;  photography prints to hand-made children’s apparel.

The Pet Blessing and Adoption Fair will be held from 10:00 am to 3:00 pm and will offer pet blessings, adoptions and fostering of a variety of animals, as well as special appearances by Pet Communicators.

The Holiday Bazaar will be held in the lot adjacent to the Milestones Charter School 4707 E. Robert E. Lee and New Vision Center for Spiritual Living, while the Pet Blessing will be held at New Vision Center’s buildings at 18010 N. Tatum Blvd. Both are located across from Moon Valley Nursery on Tatum Boulevard (between Bell & the 101) in Phoenix.

Short Sales vs. Bank Owned?

My, what a difference a year makes. In late 2008 lenders, as well as industry giants Fannie Mae and Freddie Mac dominated both the active listings and sales statistics with their foreclosure inventory. Rumors abounded about an additional looming “shadow inventory” of foreclosures which would further destroy our already decimated marketplace. The oncoming “foreclosure tsunami” was spoken of as a certainty. Fast forward to 2010 and one is met with a very different scenario than predicted. Thanks to the in-depth research done by Mike Orr at the Cromford Report we know all those industry “visionaries” were mistaken. In reality, the foreclosure (REO) market appears to have peaked in the first half of 2009. Since then the tide has steadily continued to turn from a foreclosure dominated market to a short sale market. Why?

Lenders have finally determined that an effective short sale process usually reduces their investor’s losses compared with foreclosure. In fact, one bank’s study showed an average savings of $38,000 on a short sale vs. a foreclosure. Additionally, new government incentives are now in place for lenders which reward short sales over trustee sales. For these and other reasons, many lenders are refining their short sale processes and making faster and better decisions.

Buyers have increased their willingness to buy short sales. Benefits to buyers include the reduced competition for short sales vs. REOs – as well as the ability to purchase with financing instead of the cash which REOs so often demand. Despite the patience required to wait out the months long short sale process, buyers can obtain homes generally in far superior condition to REOs and usually within 1-2% of the cost of an REO. In short, buyers have wisened to the value proposition short sales offer.

Sellers. A large proportion of homes in the valley have negative equity as most sellers either purchased after 2002 or have refinanced. Owners wishing to sell in this circumstance either need to bring extra money to the close of escrow or must attempt a short sale. The latter option is by far the most popular with sellers for obvious reasons. Therefore, short sales comprise an increasing share of the active listings while lender-owned homes are on a downward trend. While the total number of active listings has fallen by 23% since January 2009, the number of short sales offered for sale has grown by 50%.

Sellers have finally accepted that a short sale’s impact on credit ratings will usually be less than in a foreclosure. Additionally a new government program released on April 5th HAFA (Housing Made Affordable Foreclosure Alternatives) offers qualifying sellers cash incentives of up to $3000 to participate in a short sale.

We can see that short sale listings are most dominant in certain low to medium priced areas with a high proportion of new homes – particularly in the west valley. They are least prevalent in high priced areas and in those targeted at the over-55 market, where normal sales are still the majority. It is not the outlying location that is important, since we see that Rio Verde, Gold Canyon and Wickenburg are all near the bottom of the short sale league. It is not necessarily the cheapest areas either, since some of the lowest priced areas of the valley, such as parts of west and south Phoenix, show pretty ordinary rates of short sale listings (e.g. 85009 -34%, 85033 -39%). Homes in these areas are more likely to be foreclosed without an attempt at a short sale.

Conclusions

The end of the REO market is certainly not here yet but in the last few months we have seen a significant drop in the flow of new Notices of Trustee Sales suggesting that REO inventory will fall back to more normal levels over the next two to three years.

However the situation that creates short sales (negative equity will not be a quick fix. It seems very unlikely that Phoenix real estate will more than double in price anytime soon, which it would have to do to match the peak price levels seen in mid 2006 and eliminate all the negative equity created by the subsequent collapse. It also seems unlikely that sellers bringing cash to the closing table is going to ever become a popular option. So for now, and for the foreseeable future, short sales are here to stay.

Thanks to Mike Orr for what is really the heart and soul of this article.

Wendy & Russell Shaw

Market Stats Update

For the past five or six years (very much unlike my first 20 – 25 years in the real estate business) the price of Phoenix residential real estate has been front page news and sometimes even national news.  What you will see here aren’t the glaring headlines – that all sound so much better than my title for this post – but actual stats.  Hopefully, seeing them will help you to have a more accurate idea of what is happening.UpstatGraph

1.  July residential resale properties were over 9,000 for the 3rd month in a row.  You would have to go clear back to 2005 to find sales success like that.

2.  The trend for the median sales price (the middle point, half of all sales are below this number and half of all sales are above it) is overall, rising.  It is currently at 125k.  Last April it was 116k.

3.  The average (or mean) sales price is up to 175k.  March of 2009 it was 159k.

How’s The Market? An Interesting Update

I am often asked the question, “How’s the market?” by home sellers, home buyers and various local and national reporters. Answers like, “Good” or “Not very good” – which are the type of sound bite answers TV and radio interviewers seem to thrive on – don’t really honestly answer the question. Our market varies by city and it also varies by price range.MarketDistressbyCity-r

The short answer to the question above is: really good (as in ON FIRE) if we are talking about any home under 350k and a bit sluggish above 350k (the current maximum loan amount for an FHA loan is $346,250) gradiently getting worse, the higher the price range. In the upper, luxury market, inventory is so bloated that prices are indeed falling, even though homes in the one million plus market range are being sold, there are just so darn many of them.

Sales to investors – which were less than 5% of the market are now higher than 20%. Correct, over 20% of all the homes being sold currently are being sold to investors. That is more than an interesting “market indicator”. It is a loud shout that they believe today’s prices are a bargain and they are voting with their feet and their checkbooks, saying, “Yes”.

The most meaningful and useful stat (although, not perfect) for looking at short-term price movement is Average Sales Price Per Square Foot. Having been falling in our market for some time, that trend is now starting to reverse. Just slightly, and it isn’t true yet on a valley-wide basis. But it has happened. 🙂

Seeing a visual representation of lender owned properties (percent of listings and then percent of sold) can be eye opening, you might be surprised. If you are a buyer, this is the very best opportunity you have ever seen. Don’t miss it. If you are a seller, a shift for the better has already happened in the lower price ranges. As usual, I will keep you posted

2008: What Really Happened to Phoenix Real Estate?

Let me start this post by publicly acknowledging and thanking Jim Sexton, Designated Broker for John Hall & Associates, for his brilliant research (which you are about to see).  I am going to comment on and link to several charts.  In some cases I will show a small version of the chart in this post and in every instance I will provide a direct link to a full-size version of the chart.

What happened to the housing market in 2008 is quite unlike anything we have ever seen before.  Starting in January of 2006, same month sales started coming in lower than the same month the year before.  Our boom was over.  Looking at number of homes sold, for 29 consecutive months we sold less and less and less.  January of 2006 was less than 2007, January 2008 was even lower, etc.  For 29 months this continued.  Then in June of last year that trend started to reverse.  From June 2008 onward we started selling more homes.  For the last half of the year, sales each month were greater than that month the previous year.  Here you can see Home Sales Per Month for past four years and here you can see Home Sales Per Quarter and Half.  It is in this 2nd chart that what happened starts to become visible.

More houses were sold in 2008 than in 2007.  But all of that upswing happened between June and December.  Sales were actually much lower in the first half of 2008.  But look what happened to prices!Home Sales Median Price Per Month

Here is a larger version of the chart so you can look.  From the 4th quarter of 2007 all the way through 2008 the median price declined every month.  Every month.

Most analysts easily see the decline in the median price from 2006 – 2008.  It is yip-yapped about in the media almost non-stop.  But I don’t know of any (unless they just recently copied this research of Jim’s) who saw the decline throughout the year.  The median price for the year was 190k.  In January it stood at 220k but by December was 144k.

Please understand that – contrary to almost all economists “thinking” on this subject – median prices are not a reliable tool to track short-term price movement.  That is not what I am reporting here.  Median prices tell us what is selling (median price is the middle point, half of the sales are for more, half are for less).  In this case, foreclosures and lender owned properties.  Lots of them.  Average Prices suffered a similar fate.    Here is a look at how average prices breakdown and compare for the 1st and 2nd half of the year.

Average Price BreakdownYou can see a larger version of the Average Price Breakdown here.  Like me, you may be seeing a trend here.  Sales prices are sliding.  Rapidly.  Normally, in any market, sliding prices would be accompanied by falling sales.  But here we have the exact opposite happening.  Home sales are booming.  Well …. some home sales are booming.  Lender owned homes, or REO (Real Estate Owned) homes are selling and driving the prices for the entire marketplace.  Here you can see the relationship (and the current trend) between REO, open market listings and short sales.  The policy Arizona Regional Multiple Listing Service (ARMLS) had for indicating a Short Sale changed, so accurate data isn’t available for the entire year.  But let’s take a few facts that we do know: 34% of all valley home sales in 2008 were owned by lenders.  However, look at the trend: by December it was up to 52%.4th Quarter Home Sales   See a larger version of that one here24% of all MLS listings are REO.  But over half of all the sales are REO.  The Pending Sales have an even higher percent of bank owned.

Why?

Short answer, price.  Look at the difference in asking prices vs. pending prices vs. sold prices.  Notice how the REO numbers are about the same in all three categories.  Contrast that to asking price vs. sold prices for all the other listings.

All Listings vs REO Listings


What does this mean to you?  If you are a buyer, affordability is back.  This is the best news you have had in years.  The very best.  Interest rates are at historical lows and prices are way down.  It has been a long long time since buyers have anything like this – if you are moving here from out of the area or buying your first home, welcome to Home Buying Heaven.  Interestingly, if you are selling and buying a larger or more expensive home – I will say the very same thing to you.  The extreme downward price pressure is not at all at the lower end – it is the higher priced homes that are taking the big price beating.  If you have a higher priced home (right now that is probably anything much above 400k) nothing I am writing here is good news.  It only works well for you if you are selling and moving up.  If you are in the category of selling a high end home and not replacing it, right now isn’t a very good time for you to sell.  Not trying to be negative here but wanting to treat you like I would personally like to be treated: give me all the relevant facts.

For everyone else, this isn’t simply good news, it is nothing short of fantastic.  I hope you can take full advantage of this golden opportunity.