The Scales of Supply and Demand Continue to Tip

When demand started declining near the end of 2013, the inception of the buyer’s market had begun.  Market watchers held their breath praying for demand to show up – fearing without demand jumping the pile up of inventory that typically occurs in the back half of the year would become an avalanche – but the market shifted again. The normal pile-up of supply failed to show up in significant numbers.  To date, 2014 has proven to be a bit of a head scratcher.  Where does that leave us now?

The best summary of the market comes from our favorite pundit Michael Orr of the Cromford Report:

“The total number of active listings has dropped every day since May 31. Although demand remains very low by normal standards, the lack of a build up in inventory is a slightly encouraging sign for sellers….. Phoenix and Scottsdale have seen a 6% fall in active listings over the last month, while Surprise is down 10%. Chandler is the only major city showing a large gain in inventory with 9% more than one month ago.

As is often the case for this time of year, we see massive drops in inventory for Sun Lakes (down 23%), and for Sun City and Sun City West (both down 13%)

Sellers would dearly like to see a more balanced market than we have experienced in the last 8 months. If demand won’t increase, then a reduction in supply (after adjusting for seasonality) will have the equally welcome effect of improving their negotiating power.

The market balance is still weighted towards buyers, but not quite as much as in April. Demand fell back again in May after some improvement in April, but supply dropped a little faster during May than we expected and this has compensated for the weakening demand. Overall we are not seeing much change over the last few months and we are still eagerly waiting for some more significant developments, one way or the other. Boring is the worst situation if you are in the analysis and commentary business. Luckily Phoenix rarely stays boring for long.

Some misguided souls are still blaming the weak demand on interest rates. Given that rates have moved lower over the last few months and are not far about historic lows, this does not hold water. The best I can say about that point of view is that it is more credible than blaming the weather, especially across the southwest where demand has fallen hardest.

Now we are seeing an increasing number of commentators adding to the discussion of what we believe are more realistic causes of the continued weak demand for homes to buy, not just in Phoenix but across much of the country:

  • low participation by first time home buyers
  • the inhibiting effects of massive student loan debt
  • millennials preference for the flexibility of renting
  • the foreclosure wave in 2008 through 2012 which has introduced a new sensitivity to the fact that home ownership can sometimes be financially hazardous
  • a large tranche of former home owners who have not yet repaired their credit enough to re-enter the market
  • low rates of household formation, especially among 20-30 year-olds
  • a growing wealth gap causing stronger demand for high end homes but leaving large numbers of people renting for the foreseeable future

…With demand having been so weak over the last 10 months it is natural to assume that the market might see an improvement in demand as the next step. This might be dampened by the usual seasonal increase in supply that tends to occur in the second half of each year. However, the current readings suggest the opposite of what we might have expected. Demand is actually weakening a little compared with last month. On the other hand supply is also failing to show any strength and is now fading to a greater degree than demand.  In other words the market for homes to buy is contracting in size….”

So again, we ask ‘where does that leave the valley’s real estate market at the moment?’  We remain in a gentle buyer’s market.  However, a tip in either demand or supply will change the market dynamic. History says demand can increase rather rapidly – especially if buyer’s find a reason to buy (higher rents, lower interest rates, flat or declining prices, etc.)  Will it?  We will keep you posted as the future unfolds.

Market Values – Who really knows?

Prediction Is Very Difficult, Especially About the Future – Niels Bohr (1885-1962)

Niels Bohr certainly knew what he was talking about –and the intervening years have done nothing to change that sentiment.  Buyers and sellers, and their agents, have continued to struggle to interpret our market movements.  As most of our readers know, demand – and the lack thereof – has been the defining element in this market.  Much speculation has formed around this issue – with some just ignoring 2014 altogether and predicting demand will be “normal” by 2015. Any lacking demand in the resale market has most assuredly shown up in the rental market as people must live somewhere – causing available rentals to drop to very low numbers, in the range of only a 30 day supply.  Escalating demand for rentals eventually result in escalating demand for homeownership as rental rates rise.  At some point it becomes much more attractive financially to own than to rent.

If dramatic market shifts aren’t stressful enough to try to predict and understand, now add in valuation challenges.  Whether buying or selling, determining the value of the home in a highly unpredictable market can be difficult.  The more challenging the establishment of value, the more consumers seem to want to take research in to their own hands.  Uncertainty seems to create the need for multiple sources of information- i.e. automated valuations from the internet. The most famous of these sources (or in our opinion, infamous) is Zillow.  This begs the question – to whom should you trust the valuation of your largest asset or purchase?  To whom should you turn to understand the market trends and shifts?  Understandably, we have our own bias – but let us defer this issue to the one and only Michael Orr of the Cromford Report:  

“Unfortunately Zillow® has decided to provide 12-month forecasts for home values. Since the figure given is a forecast for the Zestimate® value, it does not necessarily have any relationship to real market value. On the other hand, this means it can never really be challenged because the Zestimate is created by Zillow in the first place. In the past Zillow Zestimate’s have often been greatly divergent from real market values. In the cases I have watched they have often been extremely volatile for no apparent reason, sometimes rising or falling by 10% or more in just a few weeks. I have also seen Zestimates that were 80% below or 200% above true market value, though this sort of aberration seems to be getting rarer.

In the past Zillow forecasts for the wider market have not proven to be at all accurate, so I despair at the thought that ordinary members of the public will take them seriously for individual homes. Giving a percentage change to one decimal place gives a false impression of precision for a number that is more likely to be wildly wrong than close to accurate.

In the case of my own home, Zillow is forecasting a loss in Zestimate of 1.3% over the next 12 months. That doesn’t seem too unlikely, quite frankly, but their Zestimate for my home has dropped 2.9% in just the last month and 8.2% in the last 6 months. In fact 6 months ago their Zestimate for my home was ludicrously high – some 20% higher than any other automated valuation I could find. Meanwhile Trulia’s estimated value for the same home has rocketed upward in the opposite direction during the same 6 months and they are now higher than Zillow. Home owners tend to believe the highest number they can find. The variation between these automated valuation tools is enormous and there is no evidence that Zillow’s is better (or indeed any worse) than the 25 or so other tools I have seen.

The fact is that a real appraisal or professional CMA are the only sensible ways to estimate a home value. Even these can vary a lot depending on who conducted them, and Zillow’s Zestimate numbers really should be used for entertainment purposes only. As long as they are used purely for entertainment value they not a problem. Unfortunately ordinary members of the public tend to think there is some real world basis for them, which provides nothing but problems for real estate professions who actually know what they are talking about.

For those interested in how accurate Zillow’s forecasts have been in the past … Zillow Chief Economist: Stan Humphries … in February 2012 predicted that Phoenix metro home values would increase by 0.6% between December 31, 2011 and December 31, 2012.

The actual change in average $/SF was 29.5%, so Zillow was only wrong by 28.9 percentage points.

For the country as a whole, Stan predicted a 3.7% decline in values during 2012 and no housing bottom before 2013. Funny how they never mention that any more.

The Zillow prediction for 2013 was for national home values to rise by 3.3%. Phoenix area values were predicted to rise by 8.5%. Phoenix actually rose by 16.7% in 2013 and the national increase was about 13%. Again there is almost no correlation between Zillow’s forecast and what actually happens. However I must admit that the 2013 forecast was a big improvement over the 2012 one.

In case you think I am picking on Zillow, I am not. Their forecast was actually better than many. We quote Jed Kelko, Chief Economist at Trulia: “Arizona’s home prices are going to fall by 7.2% between Q3 2011 and Q3 2012”. That was possibly the worst forecast in recent history, as average $/SF rose by 26.5% instead. Trulia’s error was 33.7 percentage points. Even this was not quite as bad as several forecasts produced between 2006 and 2012 by S&P / Case-Shiller / Moody’s Analytics many of which have been proven dramatically wrong during that 7 year period…”

If you really want to know what your home is worth, just ask.  I’m not bragging, I’m applying for a job …

Better Late than Never

2014 began with a whimper as demand from Buyers waned to historically low levels.  Sellers, who seemed to be missing in 2013, showed up but buyers seemed to be unaffected by the increased selection of homes.  Market watchers kept looking for signs of the buyer drought ending to no avail – until now.  Finally buyers have begun buying again.  Whew, let’s all take a breath.

“Buyers” as a category form two sub-categories – investors and owner occupants.  In previous articles we mentioned that the Hedge firms who had been buying for a few years here have largely ended their buying.  But investors also include the “fix and flip” groups as well as individuals buying a home or two for their personal investments.  We see that investors are buying at the lowest levels in years – a good sign in our opinion.  To quote the one and only Michael Orr of the Cromford Report:

“Except for those unusual periods, which were dramatically affected by government intervention, the last time we saw investor buying activity lower than 16.2% (the current level) was December 2008.”

This tells us that the category of buyers currently in recovery is the owner occupant buyer.  This is a positive sign.  Although the change is only newly in place, if it continues for the next few months it likely will keep our market from swinging to a strong buyer market and prevent pricing erosion.

Interestingly, buyer demand has varied dramatically according to price range.  Predictably, in the 200K and under price range both supply and demand are down.  Supply is down due to the distress product evaporating and the resulting price rises that accompany diminished distressed sales.  The dropped demand at that price come from investors leaving (as this was their preferred price point) as well as first-time buyers opting to rent rather than purchase (either by choice or necessity).

Comparing the low end housing to the high-end and you find a dramatically different story.  As Michael Orr comments:

“For Greater Phoenix in March we had 109 sales of homes priced over $1,000,000. This is the highest March number for million dollar homes since 2008. For homes priced at or below $1,000,000 we had 6,503 sales which is the lowest March number since 2008. This divergence between luxury home sales and the rest of the market is quite striking. However there are still plenty of homes over $1,000,000 for sale so supply is not an issue. It must also be remembered that a home priced at $1,025,000 this year may have been $975,000 last year.”

Needless to say, demand will be the most critical area to watch this year.  Demand will determine which direction our currently flat pricing will take.  A word of caution, don’t be mislead by potential news reports that state our “median” price is rising.  Due to the increase in high end sales and the sharp decrease in low end sales – rising median pricing could be falsely interpreted as “the market price” is rising.  At this time, pricing is flat.

When demand is weak in housing for an extended period, the population must go somewhere – and in this case it means rentals.  Demand for single family rental housing has seen a sharp increase.  Eventually this will be good news for the housing market as first time home buyers leave rentals when owning is cheaper than renting.  We are not there yet, but the signs are pointing to that as a future possibility.  Here is what the Cromford Report says:

The scarcity of single family homes available to rent is getting extreme. Other types of rentals are not so hard to find for rent, but single family homes have dried up, probably because so few new rentals are being created compared with 2010 through 2013.

On January 1 we had 4,377 active single family rental listings. Today we have 2,391. That is a 45% drop in less than 3 months. On March 1 we had 2,806 so they have dropped 15% just in the last 30 days…. if inventory remains as tight as this it is likely that landlords will take the opportunity to push single family rental rates upwards.

So the watchword for now is “demand”.  It is a situation we will continue to closely monitor and so keep our wonderful past, present and future clients fully informed.

Why Selling in a Balanced Market is actually Good

One of the most common questions that would-be sellers ask us is when is the best time to sell? The questions vary but generally sound something like this: “Isn’t it best to sell in a seller’s market?” “Now that the market has shifted to a balanced/slight buyer’s market isn’t that a horrible time to sell?” Actually, if you have a choice (and often we have no choice – selling is often driven by circumstances not under our control) selling in a balanced market may be one of the best times to sell. Here are some of the reasons we believe sellers should consider this time to get their homes on the market:

1. Price appreciation flattens in a flat market. We know this sounds counter-intuitive but bear with us as we explain this. Prices are always a trailing indicator in housing. This means that anywhere from 9-18 months after something happens in the market – it is reflected in prices. The market started shifting away from a seller’s market in June 2013 when buyer demand began withering. Pricing runs on fumes for a while before evaporating. That “fume” stage is a sweet spot for sellers because prices are gently floating up, word is not really out on the street that the shift has occurred, and the big future price appreciation that sellers would miss out on if they sell in a seller’ s market – is not being missed. In other words, when prices go flat – sellers are selling at a peak.

2. In a balanced market, builders remain conservative, adding only a trickle of new homes. In a strong seller’s market, builders – just like any other seller – want to cash in on the strong appreciation. This starts adding more and more supply of homes – which as we observed in 2005 – and can create a bubble that “pops” when supply becomes glutted. As we have seen, recovery can be painful and slow after that pop.

3. In a strong sellers market, successful sellers become “homeless” when they are unable to find a home to buy. Sellers who are buying locally, enjoy the power a seller’s market provides them as a seller, but then find themselves stressed and panicked when trying to buy in that same market. This can lead to poor buying decisions and huge concessions to obtain a home.

4. Less problems with low appraisals. An often overlooked problem in a strong seller’s market is the financing piece. Lenders base all their numbers on the appraised value of a home. In a rising market, prices begin escalating over yesterday’s pricing. While sellers often get a higher than expected yield at point of contract, they can find themselves giving that money back to the buyer when the appraisal comes in low or risk the transaction cancelling.

5. In a balanced market there are still enough buyers around to still sell without great difficulty. A balanced market means just that -buyers and sellers are in equal supply. So although the “feeding frenzy” may not be present, the buyers are still viewing and buying properly marketed properties in sufficient quantity to make selling a relatively easy and fast process.

How long will our market stay balanced? That is the million dollar question. At the moment, we see nothing dramatically pulling the market one way or another . But as Sir Isaac Newton so brilliantly said “ I can calculate the motion of heavenly bodies, but not the madness of people.” As always, we will do our best to keep you informed on the Valley’s volatile housing market.

Will This Be a Happy New Year?

2014 is not starting off with a bang. At least not yet. The 4th quarter of 2013 was one of the lowest for pending sales in many, many years (2008 to be exact). This has contributed to a dramatic shift from what was a red hot seller’s market into a balanced market and even – in many areas of the valley – a buyer’s market.

To my knowledge no major economist is predicting anything dire for the valley. Truthfully, it is not necessary to know what they are saying to see what is happening with residential real estate prices. There are only four factors that regulate the price of housing. Supply and demand, monitored by fear or greed. There are many factors that contribute to which direction the market or a market segment is heading. Probably the most important number that determines the state of the market is the current absorption rate – how long the current supply would last if the rate of sales stayed the same and no new inventory came on the market.
A perfectly balanced market is six months – actually, a range of 5 to 7 months. With a six month supply there is no price movement and neither buyers or sellers have an advantage. If we go back many years and look at what is a “normal” level of inventory we see that it is 4.5 months. A 4.5 month supply will create very gentle upward pressure on prices, about the amount necessary to keep housing in step with normal inflation. Get down to a three month supply and you can see the prices rising – it’s a “seller’s market”. Less inventory than that is a “red hot seller’s market”. Around an eight month supply you have a “buyer’s market”. These numbers are true in any market, any market segment, and in any geographic area.

As you can see, from the current chart (chart 1), the months’ supply varies considerably depending on the price range. This number also varies greatly based on geographic location. The current number for the valley (all price points and areas) is 4.9 months supply. On the inset (chart 2) you can see the recent range of the valley wide months’ supply has gone from a 5.9 months in Jan 2011 to a low of 2.2 months supply for June 2012.

One interesting observation is that the “failure rate” for listings in the MLS tends to go up sharply when the inventory level rises (i.e. homes that don’t sell). Home sellers who have highly experienced agents who can accurately read the market do not suffer from their home not selling. It is possible to successfully market a home in any market.
So what will the spring buying season bring this year? Doom and gloom or a balanced market? Truthfully, we don’t know. We suspect balanced. But, the first sign of market strength (and yes weakness) is pending sales. If we see increasing sales this spring, the cooling phase of the market is over. If not, then we are likely to have a very subdued spring season that could last more than just a season.

Weak or strong, as always, you will know just as soon as we do.

Market Roulette

2014 is beginning quite differently than 2013 did. 2013 entered as an overheated seller’s market –with inventory unusually low and properties coming to market at one of the lowest rates in history. Fast forward to 2014 and we find a very different market. Only a few geographic areas in the valley are still in a seller’s market (i.e. a market where demand exceeds supply) while most are in a buyer’s market. Knowing the market in which you are attempting to buy will guide you on how best to negotiate – can you demand price flexibility or should you expect to pay “market value” or more?! Here are the markets currently by area:
The following are still in a seller’s market: Sun Lakes, Sun City West, Anthem, and Paradise Valley.

The following are in the balanced zone: Chandler, Glendale, Scottsdale, Litchfield Park, Arizona City, Avondale, Mesa, Sun City, Apache Junction, Cave Creek, El Mirage, Phoenix.

The following are in a buyer’s market: Peoria, Tolleson, Tempe, Fountain Hills, Gilbert, Goodyear, Laveen, Gold Canyon, Surprise, Casa Grande, Buckeye, Maricopa, Queen Creek & San Tan Valley.

As always, there are variances in individual neighborhoods, as well as price brackets. A Realtor provided supply / Demand Analysis will show which is which.

How to Avoid a Bidding War

Right now in most areas of the country inventory is low and buyers are fiercely competing for houses.  In the Greater Phoenix area this is happening like never before!

Why is housing inventory so low?  In late 2006 we had over 400 active home builders here in the valley.  By late 2008 that number was under 20.  Builders not only didn’t build much for about 5 years – they still aren’t.  Yes, building permits are “way up” but not up enough to actually take care of the increasing population of Maricopa County.  Not even close.

We have fewer houses for sale and prices are rising.  It is common to have multiple offers on any desirable home.  For those buyers saying “I won’t get involved in a bidding war” we need to point out that they may need to re-think their strategy.  To avoid a bidding war a few things need to happen – builders need to be fully building (creating more supply, which will take years) and prices need to go up enough to dampen demand.  Or you can prepare for the fight and buy at prices that still are a bargain by most any yardstick.

Yes, Virginia. The Market is UP!

As 2013 approaches the halfway mark, the local market trends continue to strengthen their path.  As agents, we continue to be amazed at what a strong real estate recovery is underway in the valley.  But, as always, there is what the market is doing and then what people think the market is doing.  Public sentiment remains mixed despite the (to us) obvious recovery.  So perhaps human reaction is ultimately more interesting than any real estate market will ever be!  Nonetheless, let’s look again at the numbers comparing now with the same time last year.

Active Listings: 20,670 versus 21,841 last year – down 5.4%.

Pending Listings: 10,658 versus 11,964 last year – down 10.9%.

Monthly Sales: 8,162 versus 8,187 last year – down 7.4%.

Monthly Average Sales Price per Sq. Ft.: $113.10 versus $93.57 last year – up 21%.

Monthly Median Sales Price: $167,000 versus $130,000 last year – up 28.5%.

What does this mean?  New listings to the market, are down.  Sales are down from last year, but this is directly connected to the constricted supply rather than low demand.  There are simply more buyers than there are homes for sale.  This connects to the rising prices which are heading up again due to the unsatisfied demand (although not at the same pace of last spring).

Of great interest is the mix of what is selling.  While single family sales are down as are condo/townhome sales, in contrast mobile home sales are up 7%.  Why?  Mainly because the mobile homes new to the market are up 17% over last year’s first quarter.  This demonstrates the effect supply has on sales.

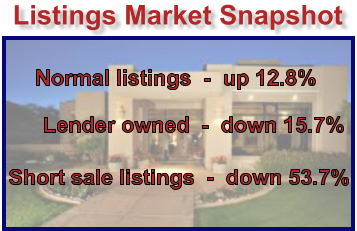
Distressed supply continues to disappear. The number of active REO (Bank Owned) listings across Greater Phoenix is down 18% in just the last month and is now down 93% from the peak in January 2009. Short sales are down 12% in the last month and are also down 93% from their peak in May 2010.  In fact, normal sales are back around a 73% market share (the highest amount since February 2008) and short sales at 16% and REOs at 11% (their lowest share since December 2007).

All of these statistics should tell you one thing, this IS the recovery.  In fact the market is healthy and what is left of the “distressed market” is so small as to be nearly irrelevant.  With that said, Hart Research Associates did a survey of 1433 interviewees during February and March of this year.  They were asked:

“Thinking now about the housing crisis that started in 2008 when many people and families defaulted on their mortgages and lost their homes, do you think the housing crisis is pretty much over, that we are still in the middle of it, or that the worst is yet to come in terms of the housing crisis?”

  • 58% think we are still in the middle of the housing crisis
  • 20% think the housing crisis is pretty much over
  • 19% think the worst is yet to come
  • 3% were not sure

Of course the facts are very clear, but 80% of the public have not yet accepted those facts. The housing crisis actually started in 2006 but the public did not really notice until 2008. By April 2009 homes in the City ofPhoenixhad pretty much lost all the value they were going to lose. From reputable analysis sources we can see that most (but not all) parts of the country were well into recovery during 2012. The majority of the general public will probably not really acknowledge the recovery until 2014 or maybe even 2015.

Unfortunately, this mental mindset is sidelining sellers who want to sell but are not certain they can. How do you know if you have equity again and can sell?  Short of an appraisal or a market analysis by your agent, there is a rule of thumb that works in the majority of the cases.  If you bought your home before January of 2004 or after September 2008 (or bought a foreclosure) – you probably now have equity.

These factors are combining to create a housing shortage for this year.  Net migration is up and the builders simply are not building enough volume to meet demand.  In the short term, it would appear sellers have plenty to smile about and buyers are likely to feel some frustration in their efforts to buy.

As always, we remain committed to keeping you informed and helping you through this ever changing market.  As always, we tip our hat to the wonderful Michael Orr of the Cromford report for his accurate market statistics.

Housing Bubble 2.0?

As we reported in last month’s issue, the market shifted (again) and January began with the lowest supply of listings coming on to the market.  This understandably has been putting pressure on pricing as supply is not abundant.  This has prompted a new rumor (I guess the persistent “shadow inventory” rumor eventually had to be abandoned) to surface.  Let’s call the new rumor “Housing Bubble 2.0” as one pundit referred to our market.  The theory goes that as prices move up we are re-experiencing a bubble such as 2005 which is doomed to be followed by a crash similar to 2007.  Before that rumor causes anyone too much heartburn, let’s go to the facts.  For facts on Real Estate in the greater Phoenix market, there is no one who documents the numbers like Michael Orr of the Cromford Report:

“Most housing analysts use data to support their observations. Those analysts tend to agree that housing is becoming a bright spot in a broader though slow economic recovery. This is particularly true in the Phoenix area, where our economy is improving a little faster than most and the housing market has been improving much faster than any other in the country. However there are also large numbers of commentators who are not data driven but tend to rely heavily on their personal theories, largely based on sentiment or political viewpoints. They tend to take one aspect of the market and amplify it out of proportion to derive their conclusions. One example of this is an article by Lauren Lyster based on the views of David Stockman, who describes the current situation as “Housing Bubble 2.0”. This is a ridiculous description of a market in which the median home price is lower than the median replacement construction cost, even excluding land values.

The observations by David Stockman have only a tentative connection with reality. His logic is flawed because, unlike the real housing bubble in 2004-2006:

  • investors in 2012-2013 are not borrowing money to buy homes – they are predominantly using cash
  • investors are buying homes to rent out for several years, not to flip after a short term rise in prices
  • we have a real housing shortage because new construction has been so low for the last 5 years while      population continues to expand
  • the pool of home buyers is being fueled by younger buyers leaving their parents’ homes at last
  • people need these homes to live in, they are not just trading commodities like they were during 2005

It is also not true that first time buyers and move-up buyers are missing. On the contrary there is a strong presence of such buyers in the market. However they often find it difficult to qualify for loans and are frequently outbid by investors when trying to purchase homes.

In 2004 and 2005 the signs of a bubble were obvious but the vast majority of people chose to ignore them. In 2012 and 2013 the signs of a bubble are absent, but many people choose to invent them.

The key issue remains – where is the new supply coming from to keep pace with demand? January 2013 saw fewer new listings added to the ARMLS database than in any January since that database was first built in 2000. The weaker sales rate in January disguised this effect but sales will not be weak from now on. The peak buying season is just about to start and we simply have too few homes available.”

We simply cannot improve on what Mr. Orr has to say.  We only add, that it is a very easy time to be a seller.  For those sellers sidelined from selling, it may be time to jump back in while competition is fierce for your home.  For buyer’s who missed the market low, they should take heart in the fact that homes are still below replacement cost.  In short, there is something to smile about.

Russell & Wendy Shaw

2012 Begins its Wrap Up

Now that we are in the waning days of 2012, it is time once again to review where we are and prepare for what will no doubt be another interesting year in 2013.  After a rather sluggish summer, the market regained some velocity in the fourth quarter.  Supply continues to build, although it is still well below average.  Below $200,000 demand remains strong and we are still seeing multiple offers.  Prices in this range continue to edge up.  Not surprisingly, the highest appreciation rates have been occurring in those places where prices crumbled the most in 2007-2009 – primarily the drive until you qualify communities.   In contrast, higher priced homes have shown only a small amount of appreciation with just a few posting double-digit improvements such as – Carefree at 11.7%, Desert Hills at 13.9% and Tempe at 11.0%

The increasing prices are luring both sidelined sellers and even builders back into the marketplace.  At some point, the increased prices will drive back the demand resulting in a balanced market.  We do expect spring of 2013 to be a very healthy market for both buying and selling.

Probably the best summary of the 2012 market is stated most perfectly by Michael Orr of the Cromford Report:

“The change in price over the last 12 months is clearly impressive. There are very few occasions in which the average price per sq. ft. rises by 25%. The only previous time I know of is May 2005 to March 2006 and that was at the height of the bubble. A rise of 2.7% in the single month of September would also normally be startling, but we have got used to big numbers. When the market eventually gets back to normal we should expect to see 2.7% for a whole year, not a single month.

What we have seen is the “coiled spring theory” in action. Supply got extremely low last year but prices refused to react until the fourth quarter of last year. Now prices have moved substantially higher we are seeing signs of the market cooling. Supply is growing as sellers start to take advantage of the higher prices achievable. Some buyers have become discouraged by the amount of competition and higher prices and so left the market, resulting in some softening of demand. Sales volumes though ARMLS are well down. However, this is somewhat misleading because a large number of real estate transactions are happening outside of the MLS. Deals between investors, new homes sales, trustee sales, pocket listings and private sales add up to a significant volume which is missing from the MLS numbers but captured by the county records. “

For the 3rd Quarter, normal sales are now 59.5% of the market. The number of normal sales should continue to grow.  Short sales have stabilized at 30.17% of the market (and we expect them to be a slowly declining part of our market for the next couple of years).  Happily, REO/HUD are now down to only 13.95% and are becoming almost irrelevant.  On that note, you may remember last month we commented on Bank of America suddenly shifting gears by taking back into their inventory REOs rather than selling them at auction to investors.  After 5 weeks of this, it appears that they have stopped that program.  Go figure.  We expect to see a small bump in REO product as these homes go to market but it still will have a negligible effect. The number of Notices of Trustee Sale inMaricopaCounty was 2,690, the lowest total since July 2007 over 5 years ago.  This is all good news.  Our hope is that by the end of 2013 REOs will be back in the “normal” range.

No matter what the new year brings, we will keep you posted on our ever-changing market.  In closing, we wish to thank all of our wonderful friends and clients for your trust and for allowing us to assist you with your real estate needs.  It is an honor to know you and to serve you.  We are truly grateful.

Russell & Wendy Shaw

(mostly Wendy)