The Housing Market Marches On

Occasionally we write articles that don’t focus solely upon current real estate market conditions.  This is not one of those times.  The real estate market in the valley has been providing headlines since late 2004.  Until the market fully returns to “normal” (it has been so long since a normal market we wonder if we will recognize it) we are no doubt destined to continue that focus.  As always, our best source for market statistics remains the brilliant Michael Orr of the Cromford Report.

First, let’s begin with some numbers comparing September 2012 with September 2011:

*Active listings with no offers – 14,405 versus 19,216 last year – down 25% but up 7% from August.

*Pending listings – 10,125 versus 11,508 last year – down 12% – and down 3% from August

*Monthly sales – 7,573 versus 8,470 last year – down 11% – and up 3% from August

*Monthly Average Sale Price per square foot – $97.45 versus $79.64 last year – up 23% – and down .7% from August

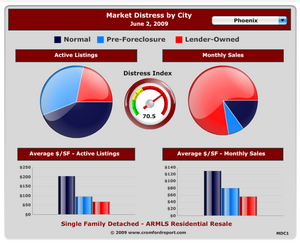
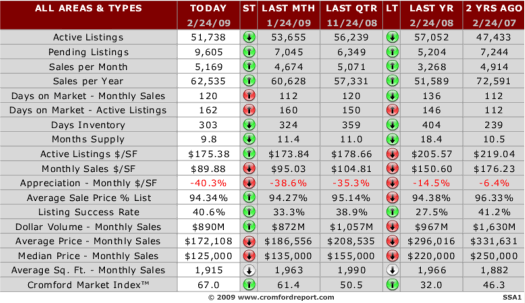
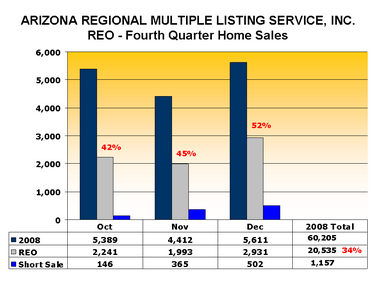
Greater Phoenix foreclosures (REO) are once again below 14% of the monthly sales total. At their peak in February 2009, they constituted 71.1% (gasp) of the monthly sales.  At this point, they are not a major factor in the market.  To put this in perspective, there were 12 times as many foreclosed homes available for sale in January 2009 as there are today.  Short sales however, comprised 30.4% of all sales in August. This figure seems to be now holding steady after an initial drop in the first quarter.

The only real shift in REOs is in regards to Bank of America, who suddenly appear to have shifted their policies and are now taking back homes rather than primarily selling them at auction to investors as they (and pretty much all lenders) did.  We now expect to see them re-enter the market as listings – no doubt to encourage higher prices as well as owner occupant purchasers.  Even with BofA composing 25% of the foreclosure pipeline, the numbers still will not hugely impact our market supply.

Normal (equity) sales continue to rise to 56.1% of sales.  This is a clear signal that sidelined sellers are finally re-entering the market as prices are beginning to allow traditional sellers to sell once again.  This number will continue to improve as the distress sales drop.

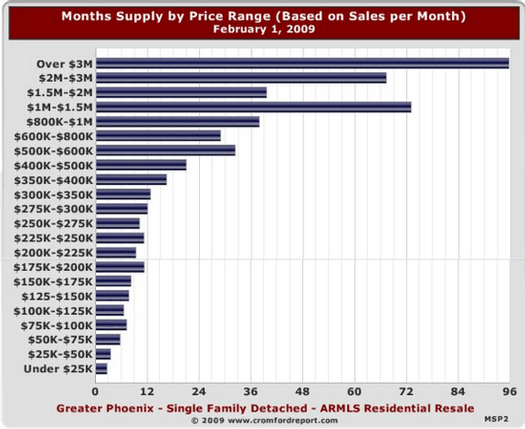
Supply continues to increase gently as is normal for this time of year – but we are seeing more significant increases particularly in Queen Creek and Maricopa – the epicenter of the price crash.  The luxury market is seeing steady supply with some small areas decreasing in supply.  The luxury market is weaker in the summer so this is not really news worthy to find supply steady with a little weaker pricing.

It should be interesting to see if builders can respond quickly to the lowered supply and begin adding to the supply through increased building.  Their challenges remain finding lots at competitive prices and qualified workers who vacated our crashing job market.

What does this mean to the homeowner?  The increased values should encourage sellers to begin to monitor values to see if they now can enter the marketplace again.  Just a note on this point, we do NOT encourage homeowners to use their county assessor valuations or “Zestimates” for determining value.  A supply/demand analysis for your neighborhood still gives the best accuracy in a marketplace that is shifting.  As always, we are here to help.

 Russell & Wendy Shaw

(mostly Wendy)

Prices are up!

We have waited since 2006 to be able to write that headline.  Yes there have been little spurts of improvement during those years (remember the tax credit of 2009?) but nothing that was headline inducing or that in hindsight really signaled much of anything other than tax breaks do work.  But this market is different and truly is making news – and some of the news is even accurate!  For those who prefer we bottom line it, the price per square foot of homes sold has moved upward at an average of 24% since September 2011.  Price per square foot is the most accurate short term tracking number.  24% is a rather amazing number by any standard, but particularly so as the national news is still reporting declines in housing values for our area.  As Mark Twain said there are “lies, damned lies, and statistics” – so what is really going on?

Remember that housing is a local issue, not a national issue.  So any discussion of our marketplace by necessity must be confined to our marketplace. So let’s look at what is a fact, the price per square foot is up by an average 24% since September.  That is a fact.  What does that mean for the home seller or buyer in this market?

First to the seller:  the message here is that the market has improved greatly and for those sidelined from selling due to value issues, it may be time to check current pricing in your neighborhood.  Does that mean every home has gone up 24%?  No.  As could be predicted, price point has something to do with the movement in values.  The lower prices (let’s say $500,000 and under) show the really significant price appreciation.  Above 500K we see a different picture with price per square foot showing both less of a drop and less upward movement as well.

Also, another factor that is slanting the numbers a bit is the dropped numbers of homes coming to market. This is one of the factors contributing to the price rise – reduced supply.  In our opinion this is the untold story of the market.  New listings coming on the market continue to hit record lows since 2011(when that statistic first began being kept).  The dropped supply is actually affecting the number of sales – Phoenix single family homes are down 18% compared to 2011 the same time of year.  Mesa sales are down 10% and Glendale is down 15%.  However, Scottsdale is up 5% over last year.  Because Scottsdale homes are more expensive on a per square foot basis, this is affecting the monthly average appreciation just by virtue of throwing higher priced homes in to the mix!  So although appreciation is on average 24% since September, that number may be a little bit higher than “reality” given the drop in lower priced sales and the increase in the higher priced sales.

To state the obvious, the best way to determine your current market value for your home is to request a Market Analysis from a competent agent (I highly recommend us).  Even then with supply and demand in flux and pricing shifting, the value is a moving target these days. A “range of value” for your home is probably the best you will do on determining pricing without actually placing your home on the market.

To buyers:  prices today are likely lower than tomorrow’s values.  If you are a buyer, be prepared for the frustration that goes with rising values, limited supply and a strong seller market.  Currently, most homes are receiving multiple offers and cash offers are abundant and often winning over financed offers.  Asking prices in the lower price ranges in particular, are just starting points for the offers as most offers will be above list price.  Those who say “I don’t want to play a bidding game”  need to understand that avoidance of this market and the competition for homes means that you are willing to pay more down the road for the benefit of being the sole bidder.

Rising prices at some point will dampen demand – the real question is how high and how long until we hit that point.  That is the million dollar question.  As the future market unfolds we will attempt to answer it for you.  As always, we are here to help you with the challenges this market presents.


Russell & Wendy Shaw

(Mostly Wendy)

Sellers Rejoice!

We’ve been waiting quite a few years to write that headline.  Is it really time for a seller party?  Well, mostly yes.  Since 2006 the market has been dropping in value.  Five years of sliding values has been demoralizing to both sellers and frankly, most agents.  Foreclosures soared, short sales have become the new “normal’ sale and most seller’s primary worry has been “can we even find a buyer for this house?” For those who prefer we bottom line this – prices are for the first time since 2005 moving stably up. There are more buyers than there are properties to satisfy those buyers, most sellers are receiving multiple offers on their homes, new supplies of listings are limited due to a severe drop in foreclosures and builders are not producing many new homes to fill the void. Welcome to March 2012.  So of all the things to worry about, sellers should not be losing sleep over whether we can find a buyer for their home – the answer is yes.  For those who enjoy more details, read on. 
 
First, where did all the builders go?  Prior to 2007 we had about 400 (yes, four HUNDRED) active home builders here in the valley.  These builders provided ample new inventory to meet any surge in demand for housing.  In fact, how much the builders could get away with charging pretty much determined the pricing for resale homes  – and fluctuations in market demand were “handled” by builders adjusting the number of homes they built. Then came the fourth quarter of 2007 and what is now referred to as the “Mortgage Meltdown” when mortgage companies began folding right and left.  The number of active builders soon plummeted to approximately 20 and even less as the market continued its decline.  What happened?  Were all builders just over-leveraged?  Were builders just not building beautiful homes?  Were all the good building sites taken?  No, the fact of the matter is that when banks became the primary seller in the marketplace and foreclosures the primary product – values dropped so dramatically that builders could not build at a competitive price.  At one time foreclosed homes were selling as low as $40 a square foot in some areas and most builders cannot build a new home for less than $100 a square foot – assuming the land they are building on is free.  At that point, most builders had to close their operations or seek other states facing less housing trauma. 
 

Currently the average price in the Greater Phoenix area is up to $85.04 a square foot (remember before you grab your calculator, this is an average of all homes at all levels of pricing and not how we price a home).  So builders are only starting to trickle back as they can charge more than a resale home – just not unreasonable amounts more.What about the “shadow inventory” that the banks are supposedly hanging on to waiting to release?  We don’t have exact numbers nationally (neither does anyone else, even when they pretend to) but in Maricopa County there is no “shadow inventory”.  Period.  Trustee sales (foreclosures) are down 40.8% from a year ago and new notices of Trustee sales (a pre-foreclosure) are also down 48.7%.  This does not mean the distress market is gone, as we won’t really eliminate the distress market until values rise along with the job market, but it does mean the pipeline of foreclosures is happily and dramatically declining.   

What does this mean for the resale market?  Most of the outlying areas hardest hit by the price collapse are the ones moving upwards most significantly over the last 12 months.  The exception seems to be the Active Adult 55+ areas lost much less value through 2005 and 2010, but are the only areas showing much price declines throughout 2011.  The luxury sector, represented by Scottsdale, Paradise Valley and Cave Creek have not moved very much in price over the last 12 months.  Supply in the luxury market is increasing with demand declining – which indicates some softness in pricing there.  But in general, anyone attempting to buy a residential property in the valley for less than $500,000 is currently finding relatively little choice and very strong competition from other buyers.  This is particularly true for buyers who need financing who are often losing out to the large number of cash purchasers.  Our thanks (as usual) to Michael Orr of The Cromford Report for supplying all the research numbers. 
 
So if you are a seller waiting for the right time to sell, this may be your time.  As always, we are here to help if you should
need us! 
 
   
Russell & Wendy Shaw  


Trend Alert

Last month we examined the overall improving market in some detail as we believe a primary function of our “job” is to keep both ourselves and our clients informed on market trends and shifts.  Trends are rarely formed in a month and so monthly news can often be repetitive more than informative.  With that risk acknowledged, we still feel duty bound to report the latest in the market.  Here are the latest trends:

Normal sales gained market share in January, moving from 40.9% to 41.40% of sales, while REOs were the big losers moving from 30.3% to 26.8%.  Short sales and pre-foreclosures advanced once again moving from 28.9% to 31.8%.  Any improving growth in normal sales is a positive recovery sign – although a cautiously optimistic one as a significant portion of these normal sales are investors doing flips.

Despite a severe imbalance between supply and demand, current pricing is fairly stable and slightly trending upward.  However, a more significant upward price movement seems likely in 2012 or early 2013. 

September 15, 2011 marked the bottom of price per square foot (the most reliable indicator of short term price movement) – coming in at an average of $78.81.  The average price per square foot for all pending listings currently has moved to above $83 for the first time in over 11 months signaling stronger sales pricing for February.

Re-sale listings are coming on to the market at a very low rate.  In the last month, 8,269 have come on the market which is 22% below the same period for 2011.  This supports the tightening supply of homes for sale, which is the force behind the upward pressure on pricing.  In fact, there are fewer single family homes listed for sale in Phoenix than in any year except 2006.  However, in Anthem there are fewer single family homes listed for sale than in any time in the last 10 years!

HUD foreclosures are down 91% from this time last year.  Trustee notices of foreclosures are down 61% from this time last year.

In short, all news continues to support the early stage of recovery is continuing.

Which brings us to another subject, if short sales now compose 31.8% of the sales and “normal” sales are up to 41.40% – the home seller (rather than the institutions) is once again the majority and retains control of the agent selection process handling their home sale.  With that in mind, we believe it is time to revisit issues surrounding that important selection.

An alarming fact of any distressed market is that opportunists arise who seek to exploit the homeseller.  One of the most obvious examples of this is “up-front fees”.  We have seen numerous agents and attorneys alike charge large, non-refundable up-front fees for loan modifications, short sales, and consultations.  In one case, a client of ours explained that a company charged $1,500 for a modification while stating to the client “this is illegal for me to charge this”.  Then this” consultant” sued the owner for the balance of the payment due and won a judgment in small claims court, despite the illegality.  Go figure!  So, with that in mind, run, don’t walk from any agent or firm demanding up-front (or back end for that matter) fees to process a modification or short sale.  Modifications belong in the realm of a free HUD counselor, and any legitimate short sale agent  won’t require fees from the homeowner but will accept payment from the short sale bank.  In our entire career, distressed market or otherwise, we have never charged sellers up-front fees.  We don’t believe others should either.

Additionally, as foreclosed home sales continue to drop, another trend is emerging – the former REO agent now trying to become a short sale specialist.  Of all the sales we handle yearly, the short sale is the most difficult and demanding of our skills.  The mass migration of REO agents over to the short sale causes us much concern.  We have been handling short sales since 2007 (well to completely date ourselves, we first handled them in the late ‘80s).  Frankly, it has taken us years of developing systems to handle the complexities associated with these files and to make sure that our clients are protected from pursuit by their lenders.  The sale of a foreclosed home is so vastly different from handling a short sale that we worry about the service and protection level that the average homeowner is receiving from these newly minted short sale agents. 

In short, if you are facing tough choices about the sale of your home – whether “normal” or a short sale, we stand ready to serve you.  In the meanwhile we will continue to report on the trends that cheer us as well as any that we believe should concern you.

Russell & Wendy

Should You Buy A Short Sale Listing?

It depends. There are definite advantages to buying a short sale listing. There are also definite disadvantages. And there are some possible additional disadvantages – depending on which agent you have.

We will take these up – one at a time.

Advantages: Price and Condition. If the transaction is handled correctly, you can usually get much more home for the money than you could get otherwise. For about the same price as a lender owned home, you can buy a short sale home in MUCH better condition.

Disadvantages: Time and Certainty. You don’t have to talk to a lot of people to find some who will tell you to NEVER BUY A SHORT SALE. It takes forever and you don’t know if the bank will ever get back to you. That can be a true statement. It can also be a false statement. This “disadvantage” is largely dependant on the point below.

Possible Additional Disadvantage: Incompetent listing agent. This is probably the single biggest variable currently. If the listing agent knows what they are doing (and many listing agents do a wonderful job in this area) communication to the bank is effective and efficient. If they don’t have experience, pricing is at a level no bank will approve, communications with the bank breakdown, and the file may straggle on for 6 or more months only to be denied.

How does a buyer combat this final disadvantage? Know your agent and make sure they have an interview sheet for the listing agent so they can determine the probability of a successful close. While this is no guarantee, it is possible to significantly jump your odds of obtaining the short sale home of your dreams.

Market Stats Update

For the past five or six years (very much unlike my first 20 – 25 years in the real estate business) the price of Phoenix residential real estate has been front page news and sometimes even national news.  What you will see here aren’t the glaring headlines – that all sound so much better than my title for this post – but actual stats.  Hopefully, seeing them will help you to have a more accurate idea of what is happening.UpstatGraph

1.  July residential resale properties were over 9,000 for the 3rd month in a row.  You would have to go clear back to 2005 to find sales success like that.

2.  The trend for the median sales price (the middle point, half of all sales are below this number and half of all sales are above it) is overall, rising.  It is currently at 125k.  Last April it was 116k.

3.  The average (or mean) sales price is up to 175k.  March of 2009 it was 159k.

Foreclosures Surge?

This was just now posted on AzCentral with the headline, "Foreclosures surged in July.  This is what passes for "reporting" by most media about the real estate market.  June foreclosures were 5,149.  July’s numbers (per the article) were 5,316.  A difference of 167 foreclosures or 3.24%.  And that is being called a "surge".marketStats

I wonder if anyone’s paycheck went up at an annual rate of 3.24% they would ever consider it a surge?

This isn’t to suggest that the number of foreclosures going up is ever a good thing – just that reading past the headlines and actually looking at the numbers might shed a bit of light on the subject.

If anyone cared to truly examine some relevant market statistics for the Greater Phoenix area here are a couple I personally find quite interesting: The current "success rate" for all listings in ARMLS is 64.8%.  You can see that (along with some other very interesting numbers) here.  But since most of the sales occurring are lender owned properties, that number doesn’t mean too much to me.  Let’s break it down.

Scroll down on this page and you will see the breakdown, based on types of listings.  The success rate (percent of all listings of that type that sell) for lender owned is 91.4%.  Not very surprising – at least not in our market.  But look at the comparison between "normal listings" and short sales.  The numbers are almost the same!  Normal listings success rate is 50.2% and short sales success rate is 49.4%.

I know, I know, the normal listings stat surged way ahead. 🙂

How’s The Market? An Interesting Update

I am often asked the question, “How’s the market?” by home sellers, home buyers and various local and national reporters. Answers like, “Good” or “Not very good” – which are the type of sound bite answers TV and radio interviewers seem to thrive on – don’t really honestly answer the question. Our market varies by city and it also varies by price range.MarketDistressbyCity-r

The short answer to the question above is: really good (as in ON FIRE) if we are talking about any home under 350k and a bit sluggish above 350k (the current maximum loan amount for an FHA loan is $346,250) gradiently getting worse, the higher the price range. In the upper, luxury market, inventory is so bloated that prices are indeed falling, even though homes in the one million plus market range are being sold, there are just so darn many of them.

Sales to investors – which were less than 5% of the market are now higher than 20%. Correct, over 20% of all the homes being sold currently are being sold to investors. That is more than an interesting “market indicator”. It is a loud shout that they believe today’s prices are a bargain and they are voting with their feet and their checkbooks, saying, “Yes”.

The most meaningful and useful stat (although, not perfect) for looking at short-term price movement is Average Sales Price Per Square Foot. Having been falling in our market for some time, that trend is now starting to reverse. Just slightly, and it isn’t true yet on a valley-wide basis. But it has happened. 🙂

Seeing a visual representation of lender owned properties (percent of listings and then percent of sold) can be eye opening, you might be surprised. If you are a buyer, this is the very best opportunity you have ever seen. Don’t miss it. If you are a seller, a shift for the better has already happened in the lower price ranges. As usual, I will keep you posted

2008: What Really Happened to Phoenix Real Estate?

Let me start this post by publicly acknowledging and thanking Jim Sexton, Designated Broker for John Hall & Associates, for his brilliant research (which you are about to see).  I am going to comment on and link to several charts.  In some cases I will show a small version of the chart in this post and in every instance I will provide a direct link to a full-size version of the chart.

What happened to the housing market in 2008 is quite unlike anything we have ever seen before.  Starting in January of 2006, same month sales started coming in lower than the same month the year before.  Our boom was over.  Looking at number of homes sold, for 29 consecutive months we sold less and less and less.  January of 2006 was less than 2007, January 2008 was even lower, etc.  For 29 months this continued.  Then in June of last year that trend started to reverse.  From June 2008 onward we started selling more homes.  For the last half of the year, sales each month were greater than that month the previous year.  Here you can see Home Sales Per Month for past four years and here you can see Home Sales Per Quarter and Half.  It is in this 2nd chart that what happened starts to become visible.

More houses were sold in 2008 than in 2007.  But all of that upswing happened between June and December.  Sales were actually much lower in the first half of 2008.  But look what happened to prices!Home Sales Median Price Per Month

Here is a larger version of the chart so you can look.  From the 4th quarter of 2007 all the way through 2008 the median price declined every month.  Every month.

Most analysts easily see the decline in the median price from 2006 – 2008.  It is yip-yapped about in the media almost non-stop.  But I don’t know of any (unless they just recently copied this research of Jim’s) who saw the decline throughout the year.  The median price for the year was 190k.  In January it stood at 220k but by December was 144k.

Please understand that – contrary to almost all economists “thinking” on this subject – median prices are not a reliable tool to track short-term price movement.  That is not what I am reporting here.  Median prices tell us what is selling (median price is the middle point, half of the sales are for more, half are for less).  In this case, foreclosures and lender owned properties.  Lots of them.  Average Prices suffered a similar fate.    Here is a look at how average prices breakdown and compare for the 1st and 2nd half of the year.

Average Price BreakdownYou can see a larger version of the Average Price Breakdown here.  Like me, you may be seeing a trend here.  Sales prices are sliding.  Rapidly.  Normally, in any market, sliding prices would be accompanied by falling sales.  But here we have the exact opposite happening.  Home sales are booming.  Well …. some home sales are booming.  Lender owned homes, or REO (Real Estate Owned) homes are selling and driving the prices for the entire marketplace.  Here you can see the relationship (and the current trend) between REO, open market listings and short sales.  The policy Arizona Regional Multiple Listing Service (ARMLS) had for indicating a Short Sale changed, so accurate data isn’t available for the entire year.  But let’s take a few facts that we do know: 34% of all valley home sales in 2008 were owned by lenders.  However, look at the trend: by December it was up to 52%.4th Quarter Home Sales   See a larger version of that one here24% of all MLS listings are REO.  But over half of all the sales are REO.  The Pending Sales have an even higher percent of bank owned.

Why?

Short answer, price.  Look at the difference in asking prices vs. pending prices vs. sold prices.  Notice how the REO numbers are about the same in all three categories.  Contrast that to asking price vs. sold prices for all the other listings.

All Listings vs REO Listings


What does this mean to you?  If you are a buyer, affordability is back.  This is the best news you have had in years.  The very best.  Interest rates are at historical lows and prices are way down.  It has been a long long time since buyers have anything like this – if you are moving here from out of the area or buying your first home, welcome to Home Buying Heaven.  Interestingly, if you are selling and buying a larger or more expensive home – I will say the very same thing to you.  The extreme downward price pressure is not at all at the lower end – it is the higher priced homes that are taking the big price beating.  If you have a higher priced home (right now that is probably anything much above 400k) nothing I am writing here is good news.  It only works well for you if you are selling and moving up.  If you are in the category of selling a high end home and not replacing it, right now isn’t a very good time for you to sell.  Not trying to be negative here but wanting to treat you like I would personally like to be treated: give me all the relevant facts.

For everyone else, this isn’t simply good news, it is nothing short of fantastic.  I hope you can take full advantage of this golden opportunity.