The real estate market is still alive and functioning –despite social distancing and stay at home orders. Like food, shelter is not 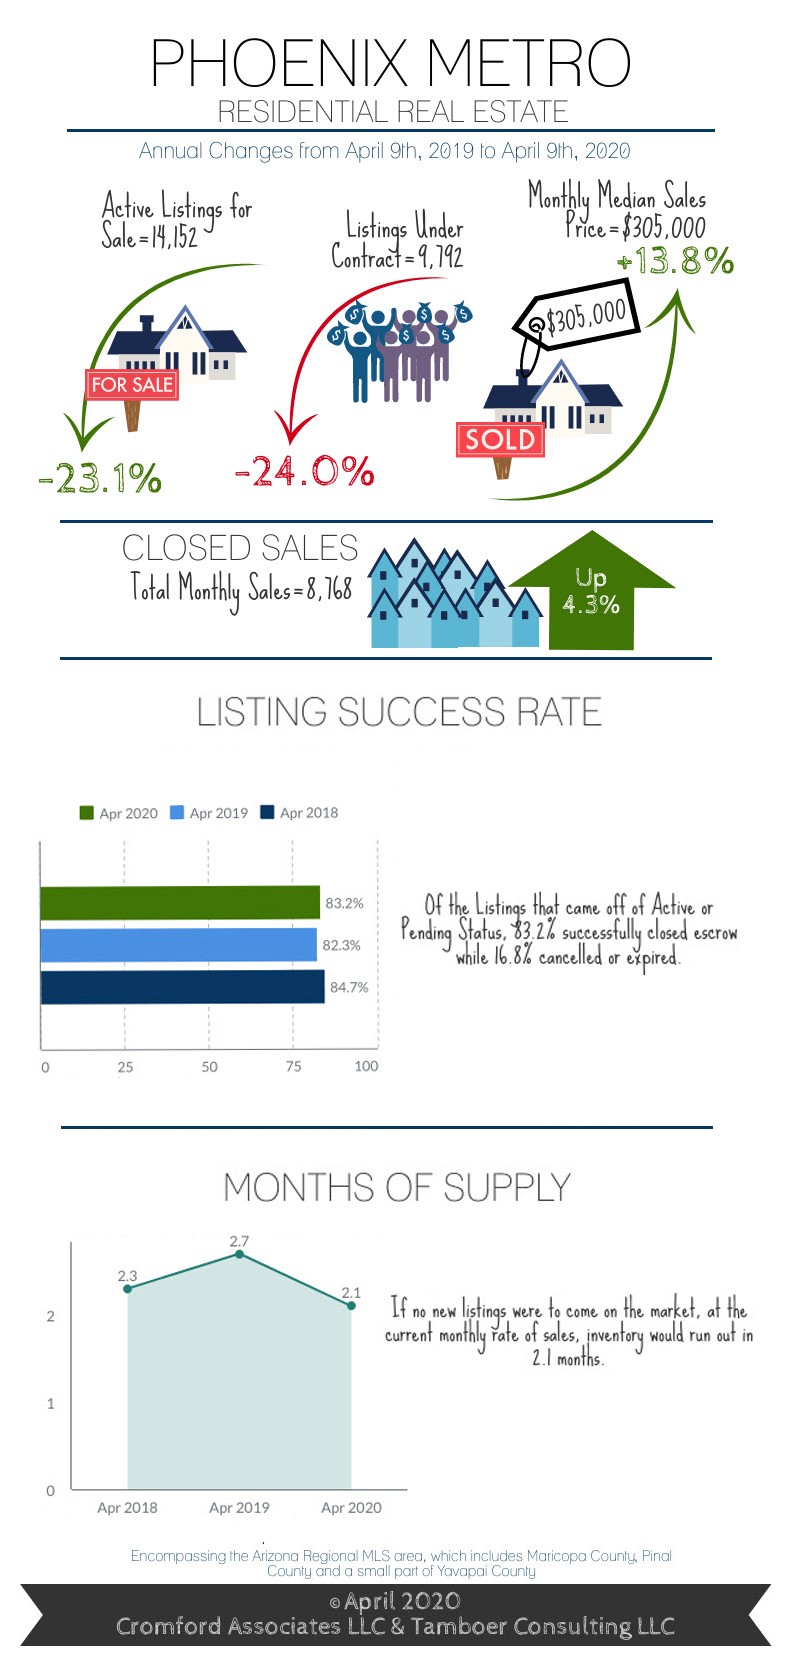 optional. Understandably there have been changes. The number of transactions has dropped, but prices are not dropping as supply continues to be much lower than current demand.
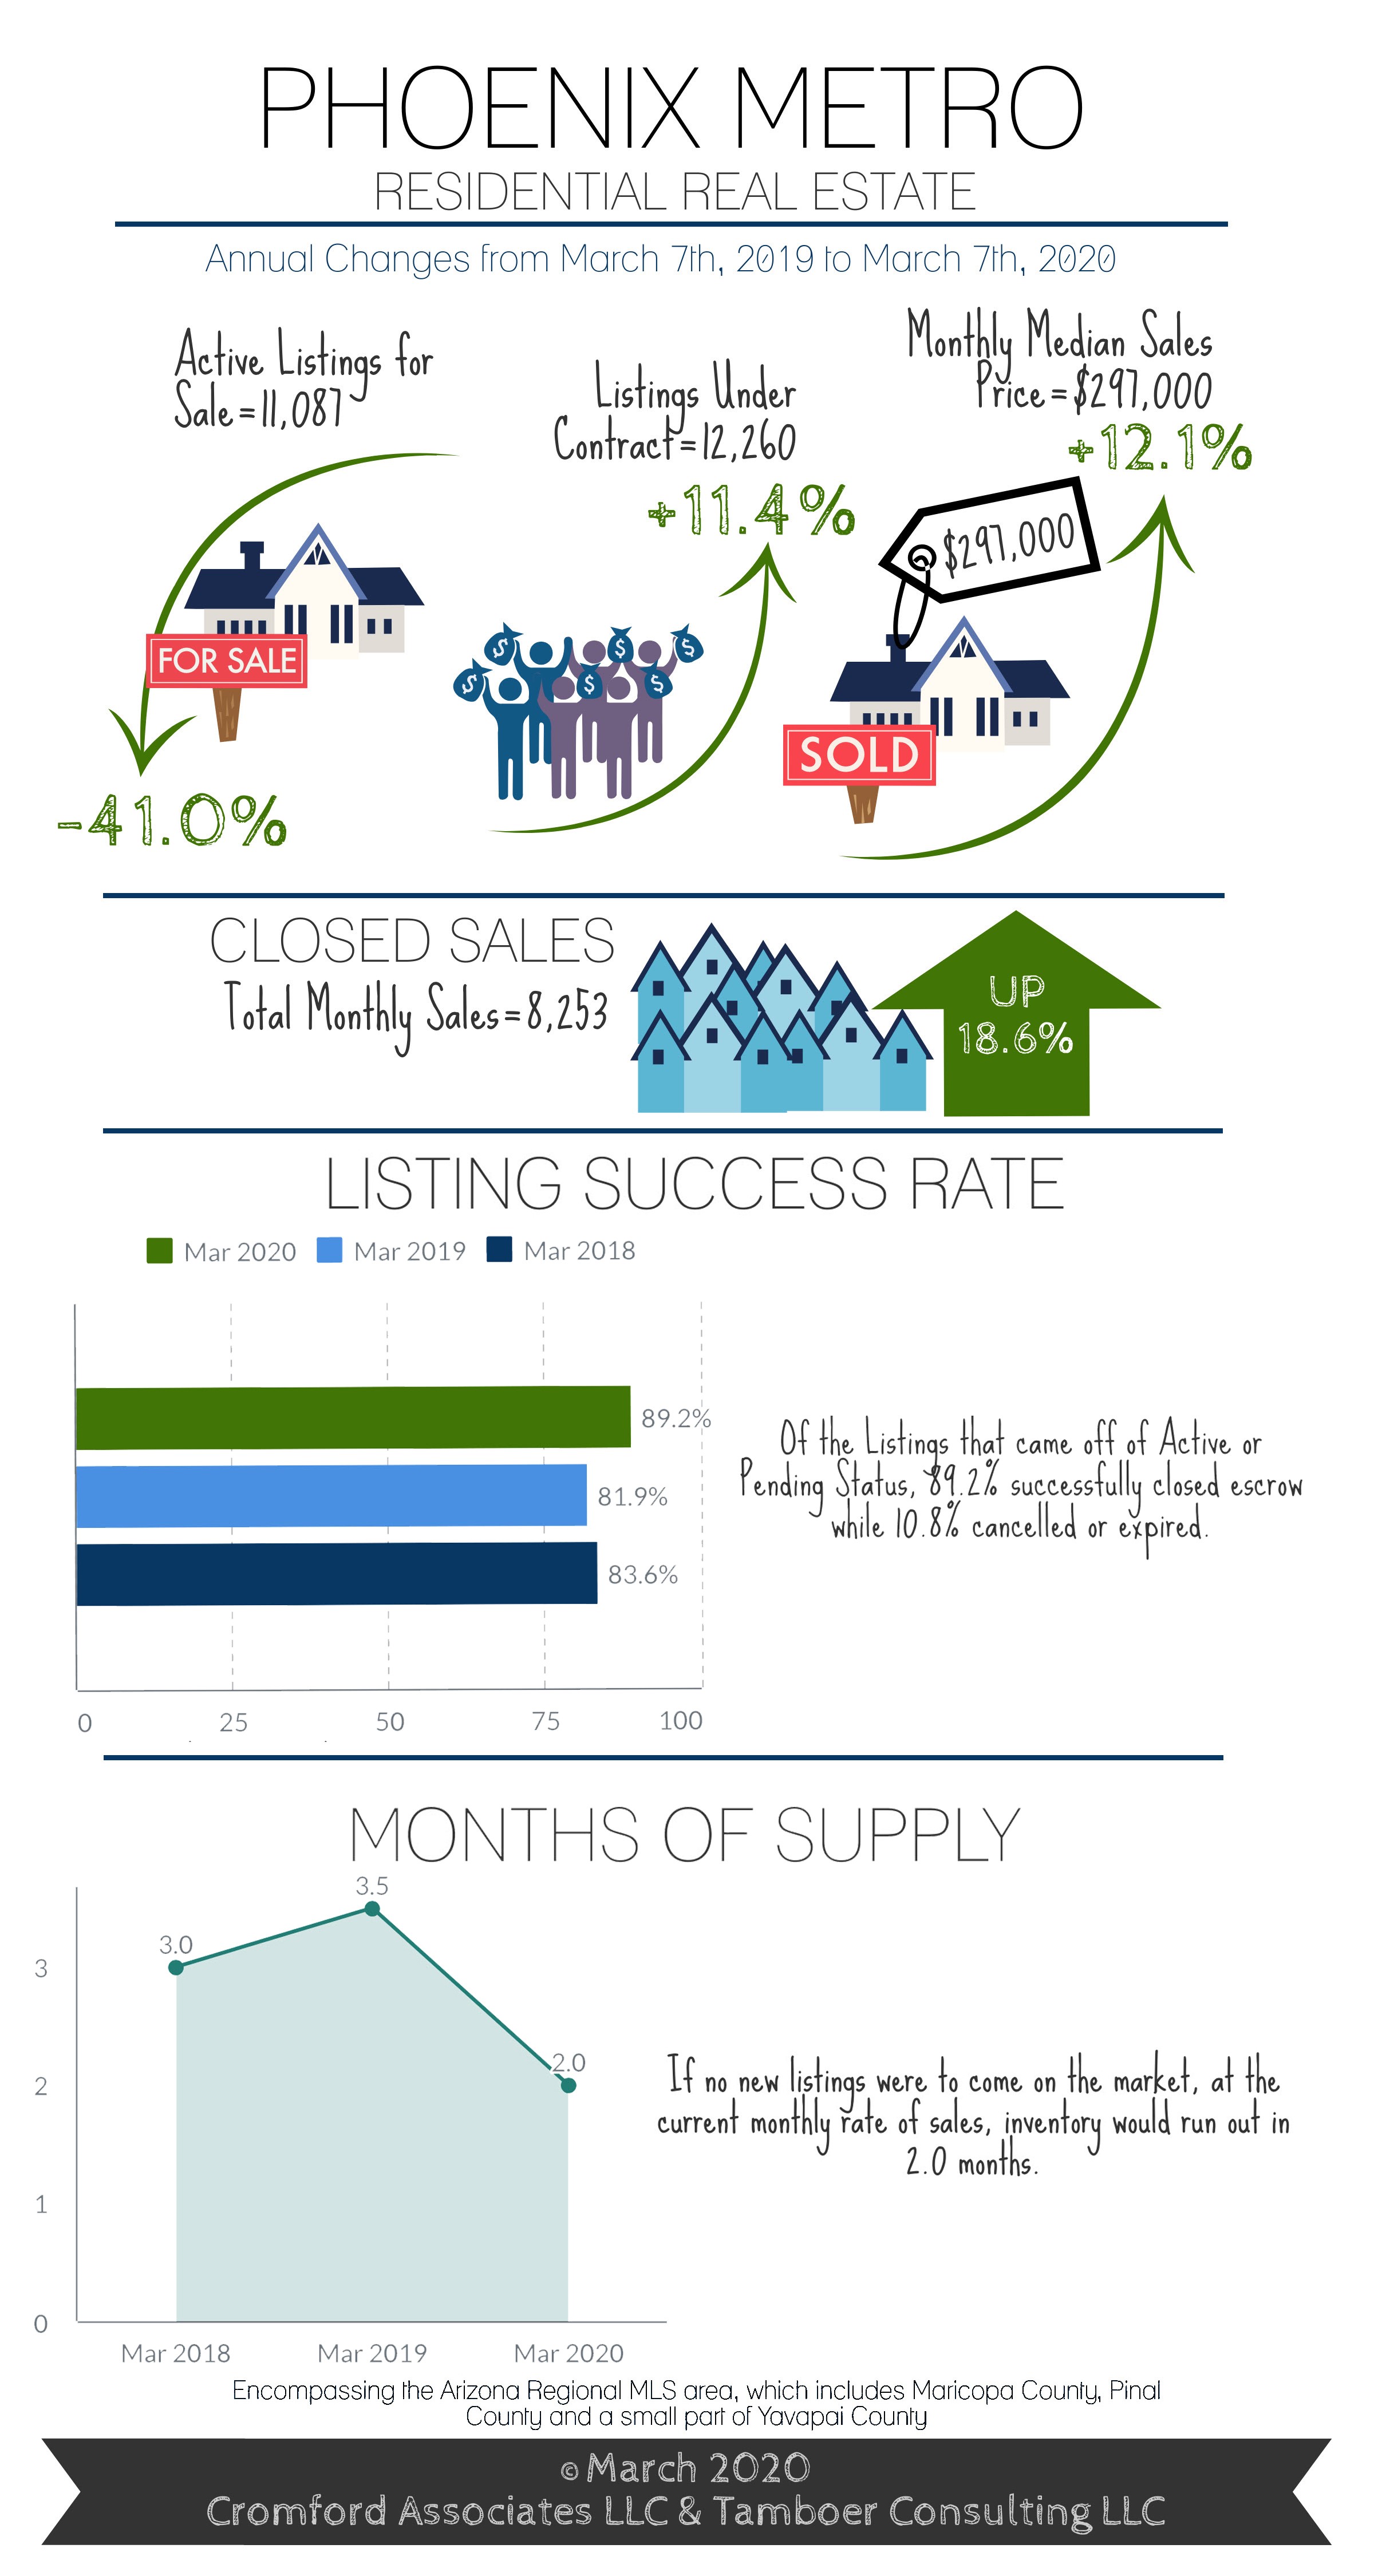
2020 began with such a disparity between supply and demand that many buyers were shut out of the housing market trying to compete against multiple offers (we would receive as many as 10-30 offers on homes). Add to that the iBuyers and investors trying to pre-empt the purchasing of homes prior to coming to market and you can see why normal buyers had a very tough road to obtain housing. The extreme lack of homes for sale resulted in accelerating prices – causing many to compare it to 2005 (erroneously I might add, as 2020 had very different traits from what was fueling the 2005 marketplace).
And then came COVID-19. To quote Tina Tamboer, Senior Housing Analyst with The Cromford Report:
“The COVID-19 pandemic came in like a wrecking ball in March shutting down tourism and crashing the stock market single-handedly over the course of a few weeks. Hedge funds and iBuyers (funded by Wall Street) bowed out of purchases and vacation rental buyers put their plans on hold. This is providing much needed relief to normal home buyers, if only they could leave their house. Stay-at-home orders to stem the impact of the pandemic has “pinched the hose” on what is arguably one of the hottest housing markets in the country. This is causing a build-up of pent up demand that will undoubtedly return with some gusto when travel restrictions are lifted and a level of stability returns. Do not expect prices in Greater Phoenix to drop like they did in 2008, however. Back then when investors pulled out of the market, prices were so high that families making the median income could only afford 27% of what was selling. This time around as investors once again pull out of the marketplace, families making the median income can afford 68% of what’s selling with today’s incomes and interest rates. This is well within normal range and puts regular home buyers in a better position to pick up the pieces left by Wall Street and vacation rental investors.”
As usual, housing markets are not only local in nature but different price points within that local market behave differently. While the under 500K price point seems to be functioning well, the luxury market has felt a larger impact. Tina Tamboer further explains:
“… The effects of COVID-19 span the job market, stock market, corporate profits, and exchange rates. This has had the highest impact on high-end luxury market buyers. Not only are these buyers restricted from leaving their home cities at the moment, they have instability in their portfolios as well. Under these circumstances it should not come as a surprise to see that weekly contract activity over $500K has slowed down by 64% since their peak on February 24th while price points under $500K have only seen a 30-40% slow down.”
If you are struggling to understand whether to buy or sell in this market, and the changes we have put in place to do so safely, please contact us. We are here to answer questions with facts and advice.
 years of practicing Phoenix real estate in all its iterations – a pandemic virus is one we haven’t lived through. But “disasters” whether war or terrorism or a housing bubble – all have one thing in common. They do not survive long term. So really, what is the worst case? Demand drops until the virus abates or is medically solved (vaccines, medication etc.) Demand can only be suppressed for so long. In the long run, the basic needs of man – food and shelter, always prevail.
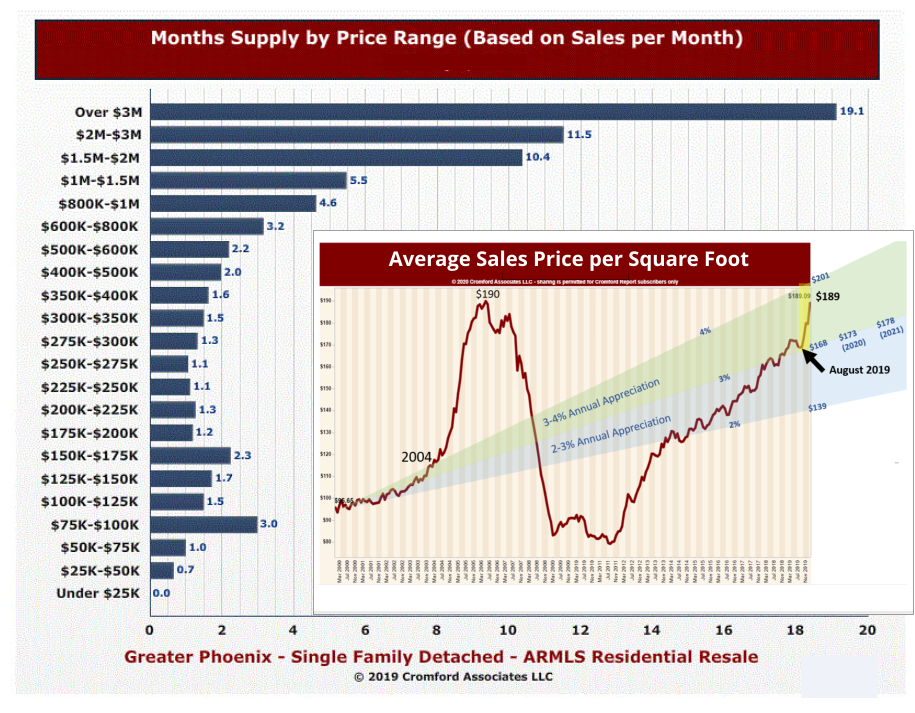 and demand determine our market forecasts. Typically we see one side of the equation having a bigger impact than the other – a situation that our market is currently experiencing.
 December, active listings grow as demand cools. This year is no exception – although the impact is a gentle one at the moment.
 now attempt to remedy that. While demand is more elastic (and therefore perhaps the sexier story) supply might actually be the buried headline.
 the Cromford Report
 have been. We ended 2018 with a rather lackluster market due to anemic demand. Entering 2019 it looked like the market was heading towards a balanced market – something we haven’t seen in the valley for years. But buyers suddenly reversed course and began to enter the market place in strong numbers. What turned things around? Two financial factors: interest rates & raised loan limits.
 prognosticators watch closely for signs of market health. In the valley the supply side of the economic seesaw (supply & demand) has been fairly stable, if persistently undersupplied. Supply changes tend to be slow moving. Demand, as we have mentioned in the past, can change far more quickly. Jitters were set off in the last quarter of 2018 when the erosion of summer demand persisted. The erosion should not have been shocking given the hit affordability took both in years of rising prices combined with a rapid rise of interest rates. As Tom Ruff in the ARMLS Blog so brilliantly explains: “The decline in year-over-year sales volume began in October as interest rates rose. Adding angst to the problem, employees saw their 401(k)s shrink as the Dow Jones Industrial and the S&P 500 indexes fell 18.8% and 19.6% respectively between the first of October and Christmas Eve. Attempting to soothe nerves, the federal government shutdown from December 22 thru January 25. Happy Holidays everyone! “