2019 began with an unremarkable start. Not surprising given that the last two weeks in December saw a large drop in listings under contract (a drop of 18.5% 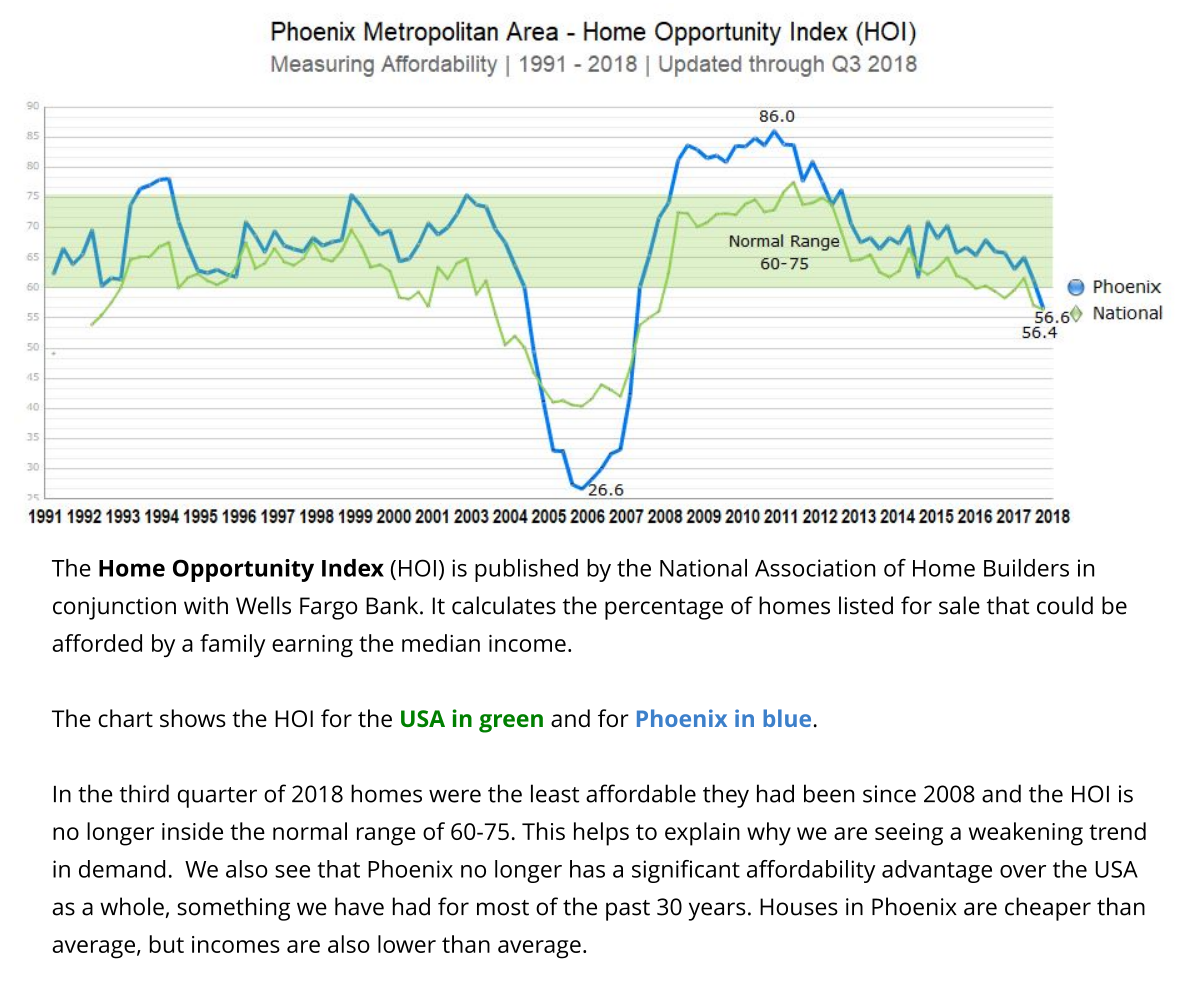 compared with the first two weeks of December – and down 10% for the month compared to December 2017). To quote Michael Orr of the Cromford Report “In every respect, December was a weak month for demand, the weakest December we have seen since 2014 for sales … We have not seen listings under contract this low on January 1 since 2008. Clearly buyers are unenthusiastic about buying homes compared with just a few months ago.” In fact, for those who follow our market updates, we had reported that buyer demand first began wavering as early as July 2018. Rising interest rates combined with higher housing prices impacted affordability, putting a gentle damper on demand. But, before we all panic, there is counter balance on dropping demand. The valley is blessed with positive net migration (i.e. population growth) which is still exceeding the current supply. So the real question is what will win in the spring buyer season? Buyers diminished appetite or the inflow of new buyers? Stay tuned, we will have that answer for you in a month or two.
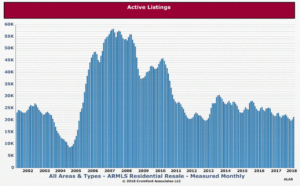
Now on to the other half of the equation, supply. The number of active and new listings coming to market – is equally unremarkable. In fact the dearth of active listings has been the saving grace in keeping the market in favor of sellers despite dropping demand. According to the Cromford Report’s numbers – supply is at about 2/3 of what is required for a balanced market. Juxtapose that to the demand index which at the moment is only 12% less demand than a balanced market. So the market remains still slightly in favor of sellers – even if weaker than 2019.
Does a weaker seller’s market mean that prices are on the edge of dropping? No. In fact buyers waiting for that may have a bit of a wait. A balanced market (which again, we are not in yet, much less a buyer’s market) does not cause prices to drop but rather appreciation to slow down and keep more in line with inflation. Admittedly affordability has taken a bit of hit – but we still are remarkably affordable when compared to other large metro areas. The Cromford Report sums up the current market succinctly:
I have started to see a few writers claim that Phoenix is becoming a buyer’s market. I think this is a huge stretch. It is possible that we have forgotten what a buyer’s market really feels like. We have seen a noticeable downturn in demand but that alone does not constitute a buyer’s market.
In a buyer’s market, supply is higher than demand and currently we still have very low supply and little sign of a significant increase on the horizon. The weaker demand is still more than enough to match the current level of supply. Consequently sales prices still have upwards momentum, although this has eased a little since last spring.
I also hear talk of lower prices, but this talk is not referring to closed sales prices. It refers to the fact that many sellers are adjusting their expectations and bringing list prices more in line with market conditions. This is not resulting in closed prices going lower than last year, as we would expect in a true buyer’s market. In fact the average price per sq. ft. for listings under contract continues to hit new highs.
We have become used to a hot, growing market that strongly favors sellers and now that it is cooler, contracting in volume and moderately favoring sellers, we have a tendency to over-react and make more of the change than it really deserves. We have to stay calm and realistic and be guided by the numbers. These numbers look like a cooling off, not a downturn. We experienced a similar, though more severe, cooling off in 2013-2014, but the last significant downturn took place between late 2005 and 2009 and was followed by a 2 stage recovery from 2009 through 2013. There was also a mini-downturn in 2010-2011 which interrupted the recovery but had little lasting significance in hindsight…
Although the market is cooler and smaller than last year, it is not in any significant trouble.
What does this mean if you are a seller? In 2019 you likely need to be more realistic on pricing and you may need to offer more assistance to buyers in need of help with closing costs. If you are a buyer, you may have a bit more strength in negotiations than in years past – but don’t be fooled in to thinking that waiting will save you money.
As always, we are here to answer any questions about your particular housing concerns. We are happy to help.
Russell & Wendy (mostly Wendy)
 will make you want to reward him with treats just for being so dang cute. Luca will use his looks and charms to get away with whatever he can, just like any typical teenager. He needs an experienced owner who will give him boundaries and structure. He will learn that he is not the one in authority and that by following consistent guidelines set by his owner he can reap the rewards of love and affection. Luca is a smart boy that does want to please. He knows the cue to sit, plays fetch, and enjoys romping with his doggie friends. Luca loves being taken out on walks and he will strut about town. You can meet Luca at Home Fur Good, Thursday, Friday or Saturday between 11 – 4. The shelter is located at 10220 N 32nd Street in Phoenix. His adoption fee is $225 and includes spaying/neutering, age-appropriate vaccinations and microchipping. You can see all the pets available for adoption at homefurgood.org.
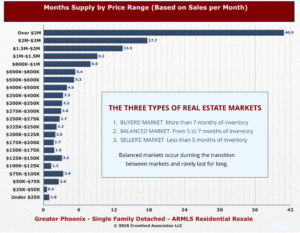
 ultimately resulting in a balanced market.
 indoors. In the summer, scorpions are actively hunting for food or a mate and can be found inside and outside. Scorpions like to shelter in dark cool places with an air flow, like cracks and crevices inside block fence walls or under palms tree bark.
 running when a treat bag rattles. His treat of choice is Temptations, and he has been known to send volunteers out to the store when the shelter runs low. Sinatra also has a way with the feline ladies. Thelma is his tabby, long-haired girlfriend. If you are looking for two cats, Thelma is also available and her birthday is 5/26/16. Sinatra loves to be up high, so if you have cat trees or shelves, Sinatra will make himself right at home! Home Fur Good open Thursday, Friday and Saturday from 11am – 4pm and is located at 10220 N. 32nd Street in Phoenix. Home Fur Good can also be reached by phone at 602-971-1134 or by emailing
 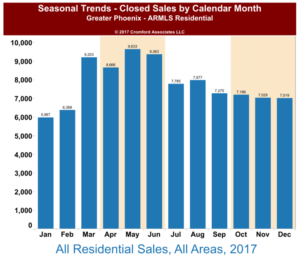 well the housing crises where supply and demand went topsy turvey. As interesting as it may be to listen to national housing statistics, they are generally antidotal. Even in the midst of the housing crisis of the “Great Recession” there were markets that saw little downturn – proving that real estate markets are local. Is the valley in the midst of dwindling demand? The short answer – a slight abating of demand is possibly underway. Is it so great to affect pricing or cause any significant impact to our market? No. This is due to the largely chronic lack of supply. Perhaps some numbers can better put this in perspective.
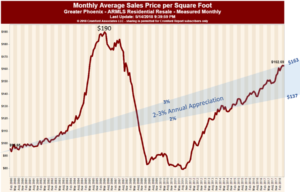
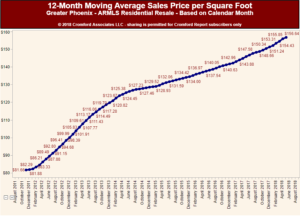 commented in the past that we are not in a “bubble”. But a recent commentary by the Cromford Report on pricing really caught our eye. It is not surprising to us that the press routinely shares erroneous housing market information often using statistics to make a poorly examined point. Homeowners would be well advised to have a skeptic’s heart when accepting the media’s research. As British Prime Minister Benjamin Disraeli so famously said (and Mark Twain popularized) “There are three kinds of lies: lies, damned lies, and statistics.” The latest premise is that housing prices have exceeded the prices set in the 2006 market. Uh… not exactly. As no one says it better than our guru Michael Orr of the Cromford Report, here are his comments (with only bolding by us for emphasis) that explain the facts about the housing numbers: