Is it just us, or has 2017 seemed to fly by? As 2017 heads to a close, inevitably we reflect and compare this year to the previous year. Although the final tallies are not in, we still can draw some solid comparisons.
PRICING
Most homeowners and would-be homeowners (buyers) find pricing statistics the most interesting of all statistics, understandably. Yet it is wise to remember that pricing is a trailing indicator – not a leading one. Pricing trends take time to show up and become meaningful. Further there is a seasonal factor that can obfuscate the market trends. For instance, in a “typical” year pricing rises during the spring buying season and tends to peak in June. Then the second half of the year goes flat on pricing (and can even have a small retreat). Pundits who don’t know or care to factor in the seasonal component of the market can write alarming headlines about the market when fall arrives – only to see it miraculously “recover” again in the spring. Annual prices tell the actual story of what occurred.
At the moment the overall market appreciation stands at 5.8% – but understand that this includes all price points and areas and is simply a market average. Separating pricing into categories tells a far more accurate story. Appreciation under 200K remains strong as demand is outpacing supply. Luxury sellers are having a very different experience – even with supply currently lower than 2016. Some luxury price points have seen a small erosion in pricing. To quote our favorite real estate source, the Cromford Report:
Price trends remain weakest for the high end of the market and despite much stronger sales numbers than last year, the top end remains over-supplied. This is not unique to Central Arizona as we see similar weakness in luxury pricing across most of the USA. The low-end and mid-range still have price momentum and given the deterioration in supply, especially in the Southeast Valley, we expect that to continue for some time.
Interestingly, condos & townhomes are enjoying a faster appreciation rate than single family homes at the moment. This is largely due to the price point and the demand they are able to answer that single family homes simply cannot fill.
Because supply/demand ratios ultimately tell the story of the market and are a leading indicator, let’s turn our focus there.
SUPPLY
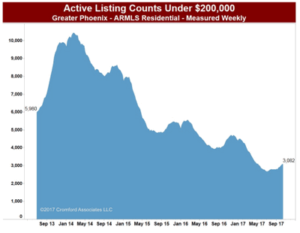
Given that appreciation has been strongest in the under 500K range – especially under 200K – it should come as no surprise that supply is most constricted under 200K. What started as a promising year of a crop of new listings, fizzled in to only a small advantage over 2016. As prices have risen, the low end of single family homes is evaporating as homes previously valued at less than 200K now rise above that mark. New supply, which usually is typically supplied by builders, is simply not coming. Builders cannot provide single family product at that price point due to land costs, labor costs, and the cost of the commodities needed to build a home (concrete, wood, roofing materials, etc.). Not surprisingly multi-family building has risen to provide needed apartment rentals for those who cannot afford to buy entry level housing. Again the Cromford Report summarizes the situation:
So far in 2017 we are up only 1.15% for new listings over this time in 2016. Overall, the supply remains chronically weak and there is little sign of any improvement… Here we can see the huge reduction in supply that has occurred over the past 4 years. The seasonal pattern clearly shows up, but each year is much lower than the year before. It is starting to look as though there will not be much of a market below $200,000 before too long.
DEMAND
Demand can be far more volatile than supply and more difficult to gage. Improving economic factors (jobs, interest rates, income, stock market, etc) or a decline in those factors can influence the housing market along with supply. The stock market showing sharp improvements can impact the luxury market to the positive, where it has little impact on the entry level market. Rising prices are supposed to have a dampening effect on demand – so that supply and demand in counter-reacting to each other create a balance. This is not always a tidy process, however, as we’ve seen through the last 10 years. So what do the tea leaves say currently about demand? We again turn to the Cromford Report:
…and demand has been slightly weakening for several months now and at first sight it looks slightly weaker again at the start of October, although when supply is poor, it can be very hard to detect weakening demand out there in the market because there is enough demand to soak up all the supply and then some.
SALES
Supply and demand intersecting ultimately results in sales. The Cromford Report supplies a lovely snapshot of the sales:
The first half of 2017 was more exciting than the second half is turning out to be so far for MLS sales. 1st Quarter 2017 MLS sales outperformed 2016 by 14% and 2nd Quarter sales were up 7%, so a 2% growth rate for the 3rd Quarter puts a damper on our excitement. Low supply in the lower price ranges is mostly to blame as it’s difficult to have record sales growth if there are fewer people willing to sell their home. There are more people willing to put their home on the market in the higher price ranges however. New listings over $600K were up nearly 10% in the 3rd Quarter and sales were up an impressive 27%.
We hope this gives you an accurate picture of the market so you can ignore any headlines to the contrary.
As the holidays approach, we want to take a moment to thank all our clients and friends whom we are so fortunate to work with. We are truly humbled by the trust you place in us and we are committed to always doing our best to protect your interests. Thank you and Happy Holidays!
Russell & Wendy
(Mostly Wendy)
 know them. She came to the shelter with her two siblings, Tanman and Louise. Yes, all three of them are still looking for homes. Thelma is very cat social, she is most comfortable when she has feline buddies to pal around with. The perfect home for Thelma will have existing cats for her to play and lounge about with. If you are really looking to make Thelma happy, you could adopt her and her siblings. Home Fur Good is located at 10220 N. 32nd Street in Phoenix. The shelter is open Thursday, Friday and Saturday from 11-4. You can call HFG at 602-971-1334. Visit the website at www.homefurgood.org.
 been area specific, so while national trends are interesting, they are not particularly meaningful when interpreting a local market. New listings to MLS in the first quarter of 2018 for Maricopa and Pinal County under 400K are logging the lowest numbers for a first quarter since the Cromford Report began tracking in 2001. Not surprisingly given the low supply, appreciation is higher than it’s been in the last several years. To quote the Cromford Report:
 motivated and aims to please, so training comes easily. Brooklyn loves to hike and has started her own peak bagging list. She is dog selective, enjoying larger dogs that like to rough house. Brooklyn would be happy in a family with one parent or one full of kids, she only wants to be an active member. Home Fur Good is located at 10220 N. 32nd Street in Phoenix. The shelter is open Thursday, Friday and Saturday from 11-4. You can call HFG at 602-971-1334. Visit the website at
  as inventory is rapidly evaporating in the low price points just like in 2005. But is this really “just like 2005”? No it really isn’t. For good or bad we have been through a number of real estate cycles (Russell entered real estate in 1978 and Wendy in 1982) so it is natural to compare the present with the past. But memory is often faulty and I think she is forgetting the real roller coaster ride of 2005. A couple of facts pulled from the Cromford Report archives for 2005 numbers vs. today’s number illustrate the point:
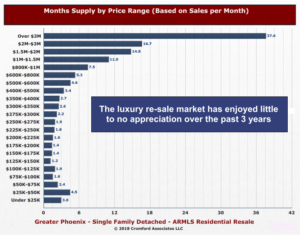 homes under 200K seem to be the wooly mammoth quickly headed for extinction. Understandably entry level buyers and their agents are bemoaning the lack of inventory in that coveted price range. Perhaps there is a need for a bit of a reality check. Phoenix is the 5th largest city in the US. The rankings currently are:
 she will entertain herself while putting on a show for you. Kimmie also does her best to make friends with the other cats and kittens at the shelter. Come down to Home Fur Good at 10220 N. 32nd Street in Phoenix. The Free Roaming Cat Room is open for adoptions Thursday, Friday and Saturday from 11am – 4pm. You can also call at 602-971-1334.
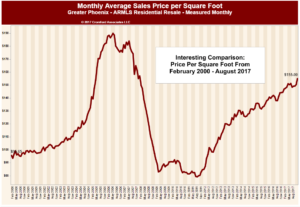
 the move. Fetch is his game and his feet start to dance when he sees the leash. He is a 35 pound Staffordshire terrier mix, perfect to fit on a lap for snuggle time or to take out on an adventure. Home Fur Good is located at 10220 N. 32nd Street in Phoenix. The shelter is open Thursday, Friday and Saturday from 11-4. You can call Home Fur Good at 602-971-1334.
 play with her and scratch her under the chin until she decides otherwise. Ginger can be very loving and playful and then she will decide she needs alone time. Ginger does ask that she be the only cat in her forever home, since there can only be one ruler. You can meet Ginger at Home Fur Good, 10220 N 32nd Street, Phoenix, Thursday through Saturday from 11am-4pm. If you have any questions please call 602-971-1334.