Low supply has stubbornly remained the major theme of the housing market for the last three years. In fact active counts of homes for sale were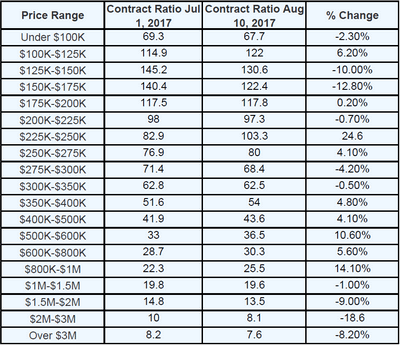 lower in only 4 years (2004, 2005, 2012, & 2013). In 2004 & 2005 “the bubble†was underway with heady demand voraciously consuming inventory. In 2012 & 2013, buyer demand was stimulated by 2011’s “bottom of the market pricingâ€. Thankfully 2017 is neither a bubble market nor a bargain basement sale – but rather a normal seller’s market.
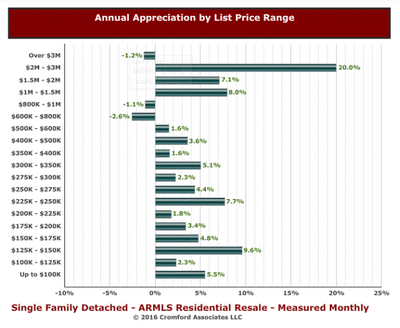
Despite the overall low supply of homes for sale, there are certain segments that have been showing an increase recently – such as homes under 175K (unexpected) as well as price ranges over 1 million (yawn -predictable). To quote Michael Orr of the Cromford Report: “While some areas & price ranges are doing better than others, the overall supply is very low representing only 84 days of inventory. We consider 120 to 150 days normal.â€
Supply is the easier of the two factors (supply & demand) to quantify. So how do we track demand relative to supply? The Cromford Report answers this dilemma by using an interesting tool to gauge the state of the market (i.e. supply vs. demand) called the “Contract ratioâ€. The contract ratio specifically measures the number of completed sales contracts relative to the supply of active listings. For those who enjoyed their grade school math class, it is specifically “100 x homes under contract divided by active listingsâ€; the higher the number the greater the buying activity relative to supply.
In August the Cromford Report posted this insightful analysis:
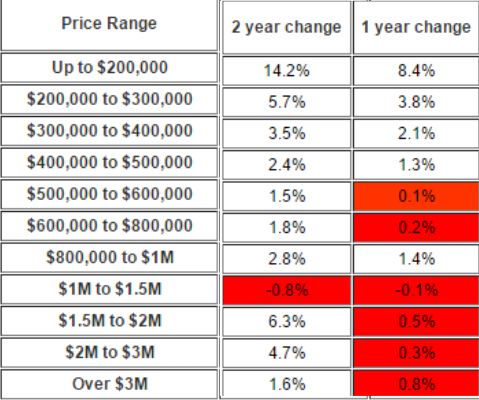
“Although it is subject to seasonal effects, the contract ratio is a useful tool for examining the state of a segment of the market. If the contract ratio is rising then the market is heating up and if it is falling the market is cooling. It is quite normal for the market to cool during the third quarter since the second quarter is when the peak buying takes place. So anywhere where the contract ratio is higher in August than it was at the beginning of June is bucking the trend and doing well. Here are how the price ranges compare (August 10 versus July 1, all property types):
We mentioned (on August 7) signs of cooling in the $150K to $200K price range for single family homes. However this is swamped by the heating up in several of the higher markets, particularly $225K-$250K and $350K-$1M.
Overall this table is unusually positive with the exception of the market over $1 million and between $125K and $175K.â€
Considering annual price appreciation has been running around 7.6% (with inflation only around 2%) it would be expected for rising pricing to reduce demand. This appears to be happening – but it is an early trend and only time will confirm if demand is going to abate enough to offset the low supply. As interest rates, income and pricing all affect affordability; dampened demand would be the reaction of a normal market. Despite alarmists saying otherwise, this is a normal market. As Michael Orr states:
“Appreciation is fine for the home owner, but translates into loss of affordability for the potential home buyer. Prices are being driven higher by a natural and persistent lack of supply, not irresponsible speculation. In this situation it is normal for prices to rise until they suppress demand enough to match the weak supply and we reach equilibrium. That is fundamental to economic theory. So we should not be surprised if sales volumes lose some of the momentum they have seen during the first half of 2017.
Of course the nature of demand is always in flux.â€
Whatever the market brings we will endeavor to keep you apprised. Of course, we always welcome your comments or questions.