The other day a REALTOR® friend of ours commented “this market feels just like 2005…well not really, but almost”. Did she have a point? Of course, there are similarities – particularly 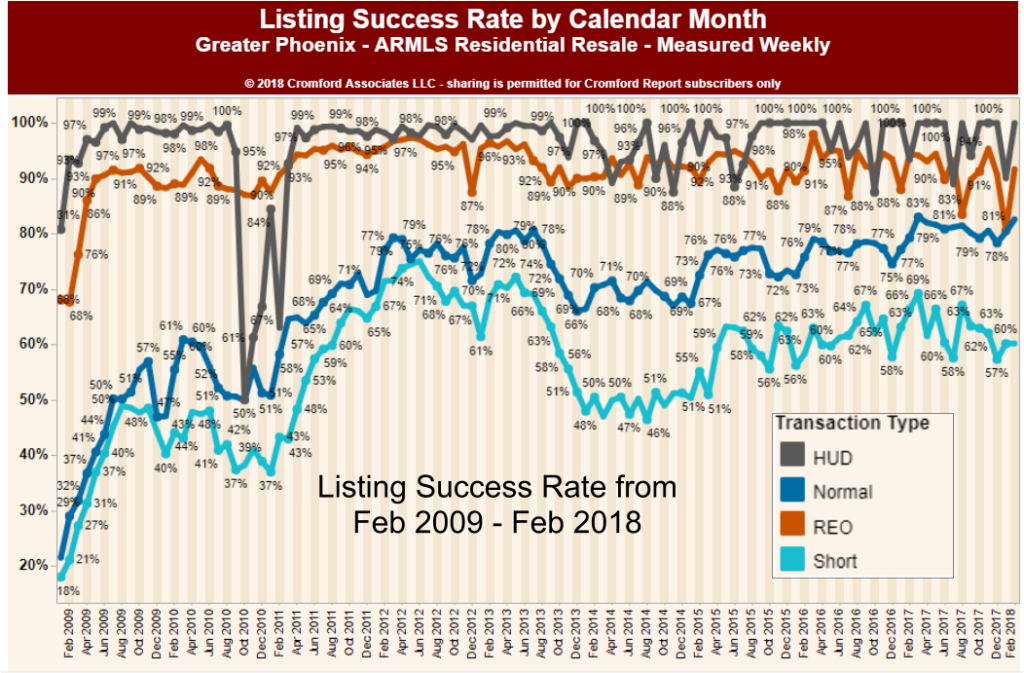 as inventory is rapidly evaporating in the low price points just like in 2005. But is this really “just like 2005”? No it really isn’t. For good or bad we have been through a number of real estate cycles (Russell entered real estate in 1978 and Wendy in 1982) so it is natural to compare the present with the past. But memory is often faulty and I think she is forgetting the real roller coaster ride of 2005. A couple of facts pulled from the Cromford Report archives for 2005 numbers vs. today’s number illustrate the point:
Days of Inventory stood at 28 (at this writing, currently 84)
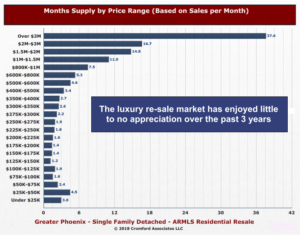
Months of supply was 0.9 (currently 3.4)
Annual appreciation rate was 27.9% (for 2017 – 6.5%)
Dollar volume was up 43.9% annually (currently up 6.8%)
Listing success rate was 84.3% (currently 80.9%)
If we subscribe to the belief that those who don’t know their history are doomed to repeat it, then perhaps it is worth looking further at a quick synopsis of the market from 2002- 2017 from the archives of the Cromford Report:
“Changes in the annual appreciation rate (measured using the annual average $/SF) give us a good indication of whether the market has been heating up or cooling down. This is using closed sales prices so it is a trailing indicator rather than a leading indicator. By using the annual average we get a fairly non-volatile reading. The trends tend to stay in place for quite some time. By looking at the weekly chart for annual appreciation we can detect when those trends change direction. Here is what we have seen so far:
- Appreciation was below 2% and weakening in early 2002, but the trend turned around in the second quarter and reached 4% by the end of the year.
- The appreciation continued to increase slowly during 2003 reaching 5.6% by the end of the year.
- Appreciation started to go crazy as the market heated up during 2004 thanks to the widespread availability of easy credit. It exceeded 12% in December 2004.
- The bubble was in full expansion mode during 2005 with appreciation exceeding 36% at the end of 2005.
- Appreciation peaked at 37.2% in March 2006 and then collapsed down to 11% by the end of the year, as the bubble burst.
- The bubble continued to deflate reaching -5% in December 2007.
- The foreclosure wave took depreciation to new depths reaching -28% in December 2008.
- The appreciation rate hit a historic low in the summer of 2009 at -36.5% but then started rising again.
- During 2010, the appreciation rate climbed to slightly positive at 0.6% but this trend ran out of steam during the fourth quarter of 2010.
- 2011 saw appreciation slide back down to -9% by 3Q but signs of new life emerged at the end of the year.
- In 2012 appreciation charged from -9% all the way up to 20%.
- Appreciation peaked at 25% during the spring of 2013 and started to drift slowly down again.
- 2014 saw appreciation drop from over 20% to less than 9%.
- In 2015 the downward trend stopped in September at 4.1% and started rising slowly again, reaching 4.4% by the end of the year.
- During 2016 the appreciation rate improved to 5.4% by the end of the year, though all of that improvement occurred during the first 3 months of the year.
- In 2017 appreciation hit a maximum of 6.5% in September and has drifted slightly lower since then, currently at 6.3%
…We should emphasize that when the rate of appreciation falls, prices are still rising, they are just not rising with quite so much speed. Only when the rate of appreciation goes negative are prices actually falling compared with the previous year. At the current 6.3% (3rd Q 2017) we are a long way above that point.
So no, this market is not like 2005 – thankfully. It took a market like 2005 to create a market like 2008, and we are all better off without such unhealthy market extremes.
As always we are happy to comment on your particular neighborhood or situation. We are always here to help.
Russell & Wendy
(Mostly Wendy)
 homes under 200K seem to be the wooly mammoth quickly headed for extinction. Understandably entry level buyers and their agents are bemoaning the lack of inventory in that coveted price range. Perhaps there is a need for a bit of a reality check. Phoenix is the 5th largest city in the US. The rankings currently are:
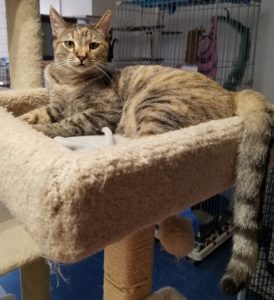 she will entertain herself while putting on a show for you. Kimmie also does her best to make friends with the other cats and kittens at the shelter. Come down to Home Fur Good at 10220 N. 32nd Street in Phoenix. The Free Roaming Cat Room is open for adoptions Thursday, Friday and Saturday from 11am – 4pm. You can also call at 602-971-1334.
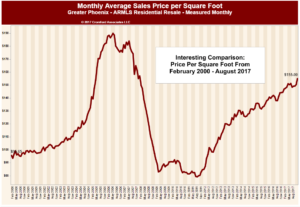
 the move. Fetch is his game and his feet start to dance when he sees the leash. He is a 35 pound Staffordshire terrier mix, perfect to fit on a lap for snuggle time or to take out on an adventure. Home Fur Good is located at 10220 N. 32nd Street in Phoenix. The shelter is open Thursday, Friday and Saturday from 11-4. You can call Home Fur Good at 602-971-1334.
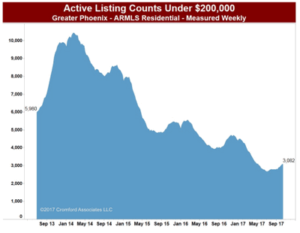
 play with her and scratch her under the chin until she decides otherwise. Ginger can be very loving and playful and then she will decide she needs alone time. Ginger does ask that she be the only cat in her forever home, since there can only be one ruler. You can meet Ginger at Home Fur Good, 10220 N 32nd Street, Phoenix, Thursday through Saturday from 11am-4pm. If you have any questions please call 602-971-1334.