Supply – a “Tale of Two Cities”

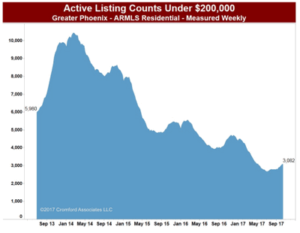
Supply continues to be the story in the valley (or lack thereof).  But it really is a tale of two cities – if the cities were price points – the 200K range vs. all other price ranges.  Single family 
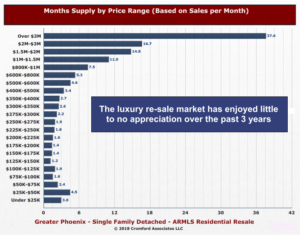
homes under 200K seem to be the wooly mammoth quickly headed for extinction.  Understandably entry level buyers and their agents are bemoaning the lack of inventory in that coveted price range.  Perhaps there is a need for a bit of a reality check. Phoenix is the 5th largest city in the US. The rankings currently are:

  1. New York
  2. Los Angeles
  3. Chicago
  4. Houston
  5. Phoenix

Phoenix has enjoyed a reputation of “affordable housing” due to its large land mass.  Whenever more houses were needed, builders had plenty of land to build them.  A steady source of new supply kept pricing low.  This brought about the “drive until you qualify” phenomena as the valley expanded ever outwards. Builders are happy to build but land, labor and material costs make them unable to bring single family housing to the market in the price range most needed. When we look at the valley in the context of cities such as New York or Los Angeles – do most buyers in those cities expect single family housing to be available at 200K?  No.  So it may be that we simply are struggling to come to grips with our big city status.

In any case, let’s take a look at where we stand in the early stages of 2018.  The year began with 14% fewer homes for sale than in 2017.  We are currently seeing a slight improvement over 2017 for the number of homes entering the marketplace (up 1.4%) – but it is early and the improvement is very small.  To quote Michael Orr of the Cromford Report:

“So the good news for buyers is that we do have slightly more homes coming onto the market. The bad news is that this is not enough to ease the supply shortage. In fact it is not even enough to compensate for the higher sales rate in 2018 over 2017. Closings are so far up 3.2% year over year so a 1.4% increase is less than half what is required to replace homes sold.

Looking specifically at Greater Phoenix we have 6,859 listings with a list date of Jan 1 through Jan 21, 2018. Compared with last year we have seen

  • 26% fewer new listings under $200,000
  • 5% more new listings between $200,000 and $300,000
  • 5% more new listings between $300,000 and $400,000
  • 12% more new listings between $400,000 and $500,000
  • 21% more new listings between $500,000 and $1 million
  • 5% more new listings between $1 million and $1.5 million
  • 36% more new listings over $1.5 million

So perversely, but not unexpectedly, we are getting the largest percentage increases at the high end of the market where more supply is not really needed. Below $200,000, where supply is already extremely thin, the new listing flow has dropped even further from last year’s rate….

However the 2% of the market over $1 million benefits from having 12% of the active listings – six times its fair share. Consequently buyers have a much easier time if they are planning to spend $1 million or more and sellers are rarely in control of the negotiations. This is why you see some spectacular price cuts in the high-end market and a sales pricing trend that is flat to slightly lower. We should emphasize that this applies to the re-sale market and not the new home market…”

If you are a seller – the price point you are in will affect your “home selling experience.  Typically, the lower the seller is on the pricing scale – the higher the odds of multiple buyers competing for your home.  When demand is out of balance with supply, in favor of sellers, multiple offers occur and there is upward pressure on pricing.

This would all appear to be good news for sellers, right?  Well yes, but a strong seller market can hide mistakes that cost sellers thousands of hard earned equity.  For example, sellers can decide to “go it alone” by either selling the home to a friend or neighbor or to a “we buy houses company”.  To many that looks like success – one buyer and the home is sold without placing it on the market.  To us in the business, that looks like a disaster. How can you know for certain what a “competitive” offer is without competition? Any home has a range of value.  What pushes homes to the top end of that range?  Competition.  Capitalism is based on that very concept.  Competition (thru marketing) is how we as agents create bidding wars for the home.

Sadly it isn’t enough to create the competition, once created one must know how to handle it.  How an agent handles multiple offers separates the men from the boys.  This again is where thousands can be made or lost.  Make sure that whomever you hire knows how to get the highest and best out of each offer and to successfully exploit that competition.

It is important to note that supply and demand imbalances will correct with time. In fact, we are already seeing lowered demand than last year. The cycle basically goes like this: tight supply increases pricing; increasing prices dampen demand; lowered demand creates more supply; more supply lowers prices.  So the pendulum of supply and demand (and thereby pricing) self corrects with time.  When will that correction begin and supply begin building?  We don’t know but we will be watching for it and will keep you alerted to any shifts. Wondering about something we didn’t address here?  Contact us.  As always, we are happy to answer your specific concerns.

Russell & Wendy Shaw

(Mostly Wendy)

Welcome to 2018

We hope you all had a wonderful holiday season!  Now that we are off to a fresh new year it makes sense to note where the market currently stands.

Supply

Undoubtedly our serial readers are already well aware that the 500K and under range has been in a “sellers” market for all of 2017.  What most may not know is that inventory usually sees a build up in the fall as demand tapers off.  Fall 2017 saw a very minimal increase in inventory and in the under 200k single family supply is so paltry as to seemingly be headed for extinction. Entering 2018, active Listings are down 12% from this time last year.   There appears to be no relief on the horizon.  As our favorite real estate market watcher the Cromford Report states:

It is easy to get complacent about the low inventory and assume that this is somehow the “new normal”. The long term decline in active listings just keeps going and we have now reached the point where days of inventory is the lowest we have seen for week 50 since 2004 (at the height of the bubble). …To try to get a handle on what life is like in the regular market, let us focus on homes priced at under $500,000 in Greater Phoenix. The inventory for this segment is 52 days. If we use $250,000 as the price limit we have just under 40 days of inventory. These are not normal readings and we start to wonder how low can these numbers go.”

This means buyers are going to have an even tougher time buying than last year in any price range other than luxury.  For most sellers, they should enjoy competition from buyers and stronger pricing.

Demand

Demand has remained relatively stable and unremarkable especially compared to its counterpart supply.  Demand was on a weakening trend in the 3rd quarter but that seemed to shift upwards mid-November and certainly provided a busier than normal December.  An interesting side note is that buyers are now primarily in-state buyers (i.e. local house changers) .  The Cromford Report notes :

 “… migration into Arizona is weaker than it was during the 2000-2007 era. In 2004 we saw 30,564 purchases by out of state buyers. 2017 year to date is 16,443 …The total sales count is lower and the percentage of sales going to out of state buyers has dropped from 20% to 16%…The flip side of this is that in-state demand has increased from 80% to 84%. Areas that appeal most to in-state buyers have seen stronger appreciation.”

Appreciation

Supply and demand ultimately dictate appreciation.  It should come as no surprise that appreciation was greatest in the lower price ranges due to low supply.  Turning back to the Cromford Report we can see exactly how true this is:

”After peaking on July 28 at 8.6% the appreciation rate for all areas & types went into a declining trend until November 9 when it bottomed out at 3.6%. It then changed course and over the last 5 weeks has risen sharply to reach between 7% and 7.5%…. Such a rapid change in direction is quite unusual.

The overall appreciation rate based on annual sale price per square foot in Greater Phoenix is 6.2%.  However, supply and demand are not the same by price range. The greatest appreciation rates are under $200K due to a lack of new construction that would typically balance out the supply shortage.  Sales under $200K are 33% of all sales this year, so their rate has a large effect on the overall average.  New multi-family and single-family homes are being added to the $200K-$500K price range to accommodate increased demand, but it’s still not quite enough.  The market is balanced between $500K-$1M, while supply is still higher than demand over $1M despite a 10% rise in 4th quarter contracts.  As a result, appreciation rates are as follows by price range:

  • Under $200K:  7.7%
  • $200K-$500K: 3.5%
  • $500K-$1M: 1.7%
  • Over $1M: 0.1%”

Agents

We rarely talk about real estate agents – although they certainly can impact the marketplace in subtle ways.  It may be of interest that there was a 6.6% increase in the number of real estate agents since last year as rookies continue to enter the field. While agents certainly don’t set the marketplace (supply and demand does) they certainly can influence the buying and selling experience. Agent skill impacts the counsel clients receive on market behavior or not; negotiate the highest market value or not.  They should be the client’s biggest advocate and legally in fact have a fiduciary relationship to the client.  As the institutional investment companies are swarming the valley (Offer Pad, Open Door, etc.) sellers can learn the hard way the impact that a missing real estate advocate has in terms of reduced proceeds.  Particularly disturbing is the institutional buyers’ offers of “no commission sale” while charging fees in excess of 9% – far beyond what might be charged as a commission.  Add in the typically lower than market value and imaginary “repair costs” and sellers are paying dearly for that lack of representation.  Lower than true market value sales can impact appraisals and subsequent neighboring sales – a sobering thought for all of us vested in defending neighborhood values.

As 2018 continues to progress we will endeavor to keep you apprised of the emerging trends.  Of course every home sale has its own concerns, so please don’t hesitate to contact us for a customized analysis of your neighborhood.  Here’s to a wonderful 2018!

Russell & Wendy Shaw

(Mostly Wendy)

2017 Draws to a Close

Is it just us, or has 2017 seemed to fly by?  As 2017 heads to a close, inevitably we reflect and compare this year to the previous year.  Although the final tallies are not in, we still can draw some solid comparisons.

PRICING

Most homeowners and would-be homeowners (buyers) find pricing statistics the most interesting of all statistics, understandably.  Yet it is wise to remember that pricing is a trailing indicator – not a leading one.  Pricing trends take time to show up and become meaningful. Further there is a seasonal factor that can obfuscate the market trends.  For instance, in a “typical” year pricing rises during the spring buying season and tends to peak in June.  Then the second half of the year goes flat on pricing (and can even have a small retreat).  Pundits who don’t know or care to factor in the seasonal component of the market can write alarming headlines about the market when fall arrives – only to see it miraculously “recover” again in the spring.  Annual prices tell the actual story of what occurred.

At the moment the overall market appreciation stands at 5.8% – but understand that this includes all price points and areas and is simply a market average.  Separating pricing into categories tells a far more accurate story.  Appreciation under 200K remains strong as demand is outpacing supply.  Luxury sellers are having a very different experience – even with supply currently lower than 2016.  Some luxury price points have seen a small erosion in pricing.  To quote our favorite real estate source, the Cromford Report:

Price trends remain weakest for the high end of the market and despite much stronger sales numbers than last year, the top end remains over-supplied. This is not unique to Central Arizona as we see similar weakness in luxury pricing across most of the USA. The low-end and mid-range still have price momentum and given the deterioration in supply, especially in the Southeast Valley, we expect that to continue for some time.

Interestingly, condos & townhomes are enjoying a faster appreciation rate than single family homes at the moment. This is largely due to the price point and the demand they are able to answer that single family homes simply cannot fill.

Because supply/demand ratios ultimately tell the story of the market and are a leading indicator, let’s turn our focus there.

SUPPLY

Given that appreciation has been strongest in the under 500K range – especially under 200K – it should come as no surprise that supply is most constricted under 200K.  What started as a promising year of a crop of new listings, fizzled in to only a small advantage over 2016.  As prices have risen, the low end of single family homes is evaporating as homes previously valued at less than 200K now rise above that mark.  New supply, which usually is typically supplied by builders, is simply not coming.  Builders cannot provide single family product at that price point due to land costs, labor costs, and the cost of the commodities needed to build a home (concrete, wood, roofing materials, etc.).  Not surprisingly multi-family building has risen to provide needed apartment rentals for those who cannot afford to buy entry level housing.  Again the Cromford Report summarizes the situation:

So far in 2017 we are up only 1.15% for new listings over this time in 2016. Overall, the supply remains chronically weak and there is little sign of any improvement… Here we can see the huge reduction in supply that has occurred over the past 4 years. The seasonal pattern clearly shows up, but each year is much lower than the year before. It is starting to look as though there will not be much of a market below $200,000 before too long.

DEMAND

Demand can be far more volatile than supply and more difficult to gage.  Improving economic factors (jobs, interest rates, income, stock market, etc) or a decline in those factors can influence the housing market along with supply.  The stock market showing sharp improvements can impact the luxury market to the positive, where it has little impact on the entry level market.  Rising prices are supposed to have a dampening effect on demand – so that supply and demand in counter-reacting to each other create a balance. This is not always a tidy process, however, as we’ve seen through the last 10 years.  So what do the tea leaves say currently about demand?  We again turn to the Cromford Report:

and demand has been slightly weakening for several months now and at first sight it looks slightly weaker again at the start of October, although when supply is poor, it can be very hard to detect weakening demand out there in the market because there is enough demand to soak up all the supply and then some.

SALES

Supply and demand intersecting ultimately results in sales.  The Cromford Report supplies a lovely snapshot of the sales:

 The first half of 2017 was more exciting than the second half is turning out to be so far for MLS sales. 1st Quarter 2017 MLS sales outperformed 2016 by 14% and 2nd Quarter sales were up 7%, so a 2% growth rate for the 3rd Quarter puts a damper on our excitement. Low supply in the lower price ranges is mostly to blame as it’s difficult to have record sales growth if there are fewer people willing to sell their home. There are more people willing to put their home on the market in the higher price ranges however. New listings over $600K were up nearly 10% in the 3rd Quarter and sales were up an impressive 27%.

We hope this gives you an accurate picture of the market so you can ignore any headlines to the contrary.

As the holidays approach, we want to take a moment to thank all our clients and friends whom we are so fortunate to work with.  We are truly humbled by the trust you place in us and we are committed to always doing our best to protect your interests.  Thank you and Happy Holidays!

Russell & Wendy

(Mostly Wendy)

Struggling to Recognize a Normal Market?

For those who prefer an article in a Twitter-like format – supply is still constrained, demand appears to be slowing (is this seasonal or an actual decrease?) and we are in the midst of a very “normal” market. For those who prefer details, continue on.

The problem with a “normal” market is that the Valley went through such an extended period that was NOT normal (2004-2011). Long periods of abnormality can start to feel like the new normal – so when normal actually shows up it is apparently unrecognizable as such. Homeowners are understandably confused when reading inflammatory housing headlines meant to snag readers. Headlines such as “The Valley is in a Normal Real Estate Market” is a snooze fest so don’t be startled when various news sources claim otherwise. To site a few recent examples, Ed Delgado, President and CEO of Five Star announced at a conference for “foreclosure specialists” that foreclosures are going to go up in a number of cities, one of which was Phoenix. Much to the contrary, delinquencies in the valley are lower than any time since 2002, to have foreclosures you must first have delinquencies. Forbes also recently published a headline “58% of Homeowners think the housing market is set for a correction –are Bubble Fears Founded?” To answer the question – no – bubble fears in the valley are not founded. Housing Wire similarly states that Phoenix is one of the states “overheated” and “overpriced by double digits”. Hmmm – interesting theory but again not factual.

So to state the facts again (our apologies to those who believed us the first time we spoke to this issue) we are in a normal market. Supply, when constrained comparative to demand, causes prices to rise. Rising prices cause supply to rise and demand to dampen, resulting in a leveling off of appreciation as supply and demand begin to balance or even correct to the buyer’s advantage. Real estate typically goes in cycles of this pattern over and over – the question is only how long each cycle will last. To summarize the current state of the market, we turn to the Cromford Report:

Supply remains lower than last year, but the gap closed slightly compared with last month in terms of active listings with no contract. We are starting to see more new listings than last year. The third quarter is up 2.5% from last year and up 5.5% from 2015. So far the extra supply is not having much effect, but if it continues for several months finding a property could start to get a little easier for buyers.

The monthly sales rate is up only 1.8% compared with a year ago. Both August 2016 and August 2017 had the same number of working days (23) so we have a fair comparison to draw. Since the year over year growth was 5.7% in June and 3.0% in July we again see a continuing slow downward trend in the advantage that 2017 has over 2016 in sales volume. Growth in the annual sales rate has almost stopped with 95,000 proving to be a difficult line of resistance. All these point to a gradual fading of demand. The serious shortage of supply obscures that fade…

We still have a seller’s market in most locations and price ranges, but the current trends means the seller’s advantage has very little momentum. Before buyer`s get too excited, the trends are very mild in nature. As such we do not currently see major increases in buyer’s bargaining power coming anytime soon.

A further interesting Cromford Report discussion point is does a normal market mean the valley has “recovered”? The Report brilliantly speaks to this point:

…Many people assume when prices have returned to 2006 peak levels then the market has recovered. However understandable, especially for those who purchased during that time frame, that’s not necessarily the case. Average sale prices per square foot are still 27% away from the peak of 2006. However, the market could arguably be considered recovered once prices reach the range that corresponds to the long term average rate of inflation, which from 2000-2016 in the United States is 2%. In 2000, the average sales price per square foot for MLS resales was $96. Had the bubble and crash never happened, and annual appreciation stayed between 2-3% per year as normal, then prices would land between $134-$158 per square foot today. Currently they’re running at $149, which equates to averaging nearly 2.6% annually and a 55% total gain since the year 2000.

So normal and recovered seem to be hand in hand in the valley. That should be good news for jittery homeowners reading way too many headlines. As always, we are here to help you understand your home in today’s marketplace. We appreciate and welcome your questions and comments.

Russell & Wendy Shaw
(mostly Wendy)

Supply remains low. Will demand follow?

Low supply has stubbornly remained the major theme of the housing market for the last three years.  In fact active counts of homes for sale were lower in only 4 years (2004, 2005, 2012, & 2013).  In 2004 & 2005 “the bubble” was underway with heady demand voraciously consuming inventory.  In 2012 & 2013, buyer demand was stimulated by 2011’s “bottom of the market pricing”.  Thankfully 2017 is neither a bubble market nor a bargain basement sale – but rather a normal seller’s market.

Despite the overall low supply of homes for sale, there are certain segments that have been showing an increase recently – such as homes under 175K (unexpected) as well as price ranges over 1 million (yawn -predictable). To quote Michael Orr of the Cromford Report: “While some areas & price ranges are doing better than others, the overall supply is very low representing only 84 days of inventory. We consider 120 to 150 days normal.”

Supply is the easier of the two factors (supply & demand) to quantify.  So how do we track demand relative to supply? The Cromford Report answers this dilemma by using an interesting tool to gauge the state of the market (i.e. supply vs. demand) called the “Contract ratio”.  The contract ratio specifically measures the number of completed sales contracts relative to the supply of active listings. For those who enjoyed their grade school math class, it is specifically “100 x homes under contract divided by active listings”; the higher the number the greater the buying activity relative to supply.

In August the Cromford Report posted this insightful analysis:

“Although it is subject to seasonal effects, the contract ratio is a useful tool for examining the state of a segment of the market. If the contract ratio is rising then the market is heating up and if it is falling the market is cooling. It is quite normal for the market to cool during the third quarter since the second quarter is when the peak buying takes place. So anywhere where the contract ratio is higher in August than it was at the beginning of June is bucking the trend and doing well. Here are how the price ranges compare (August 10 versus July 1, all property types):

We mentioned (on August 7) signs of cooling in the $150K to $200K price range for single family homes. However this is swamped by the heating up in several of the higher markets, particularly $225K-$250K and $350K-$1M.

Overall this table is unusually positive with the exception of the market over $1 million and between $125K and $175K.”

Considering annual price appreciation has been running around 7.6% (with inflation only around 2%) it would be expected for rising pricing to reduce demand.  This appears to be happening – but it is an early trend and only time will confirm if demand is going to abate enough to offset the low supply.  As interest rates, income and pricing all affect affordability; dampened demand would be the reaction of a normal market.  Despite alarmists saying otherwise, this is a normal market.  As Michael Orr states:

“Appreciation is fine for the home owner, but translates into loss of affordability for the potential home buyer. Prices are being driven higher by a natural and persistent lack of supply, not irresponsible speculation. In this situation it is normal for prices to rise until they suppress demand enough to match the weak supply and we reach equilibrium. That is fundamental to economic theory. So we should not be surprised if sales volumes lose some of the momentum they have seen during the first half of 2017.

Of course the nature of demand is always in flux.”

Whatever the market brings we will endeavor to keep you apprised.  Of course, we always welcome your comments or questions.


How To Get Less Money When You Sell Your House

Every day we field calls from sellers checking on what they can do to their home to increase the home’s value prior to sale.  These questions center around improvements such as solar (we don’t recommend) painting (yes!) flooring and so on.  Yet one of the biggest forfeitures of value is “to whom” and “how” we sell.

To whom we sell.  End users always pay the most for any product – whether a home or a car.  It has the highest value to them as they are the ones with the need.  Selling to an investor typically brings a lower value because they are not the end user and there is no emotional connection to the home.  Owner occupants pay more – but even amongst those buyers the value can vary widely depending on how motivated they are and how limited their other options are (i.e. if the home serves a particular need such as dual master bedrooms, handicap accessible, a certain school district, etc.)  In negotiation, the concept “he who needs the deal the most, gives the most” proves true.

How we sell.  When we sell with no competition value typically drops.  The very premise behind capitalism is that an open market sets pricing.  The smaller the pool of buyers exposed to your home, typically the smaller the value.  In other words, you can artificially hold down demand by limiting exposure to your home.  By owner sales and direct to owner investor offers fall in this category.

Even homes that must only sell to an investor (severe property condition issues or tenants on long term leases) will obtain higher values if they pay attention to “how they sell”.  In short, the way to get top dollar is to expose the property to the most available buyers.  If an investor is the only option as a buyer, creating competition amongst those investors will typically better protect value.  What most sellers don’t know is that those investors flooding your mailbox with “we will buy your home” offers – will also make offers to listed homes that meet their criteria.  That is good news for sellers wanting an investor offer as a good listing agent can attract multiple investors and make them compete on price and terms for the home.  Also a listing agent can help the seller understand the real costs behind the “you pay nothing” investor offers.  Anytime venture capitalists are spending millions funding “We buy homes” companies, you can be assured you are NOT receiving a “no cost” offer for your benefit.  Venture capitalists only spend money when they believe there is plenty of money to be made for them.  Who is paying them?  The often unsuspecting home owner is paying them in lost equity.

Don’t believe us?  Let us give you a real life example of an offer we received on one of our seller’s homes:

Opendoor used a team of local real estate professionals and a proprietary valuation model to determine their offer on your listing at 16947 Durango St:

  • Valuation: $230,000
  • Service charge, to cover holding costs and liability while finding a buyer: $17,250
  • Net offer price: $212,750
  • Opendoor cannot purchase this listing if it has the following features: unpermitted additions, leased solar panels, in a gated or age-restricted community

…. The net offer does not include the buyer’s agent commission.

Opendoor will have inspections performed by a licensed, independent home inspector and will submit a Repair Addendum like a traditional buyer…  

The service charge is 7.5% for the listing side, which does not include the buyer commission that must be paid (in this case 3%).  Those percentages are well above anything we charge in commissions.  This makes the claim “save on commissions” dubious at best. But you decide if this example looks like a “savings” as we listed and sold this very house for our seller.  Here is what happened when we placed it on the market:

Russell Shaw Sale

Sales price:  $234,900

Commission: 6% (3% + 3%)

Time on market: 20 days; 33 day close

Sales price vs. list price : full price

Repairs required to close:  4 minor repairs

vs.

Open Door

Sales price: $230,000

Commissions and/or holding costs – 7.5% + 3 % = 10.5%

Time to close: 14-60 days

Repair required to close:  unknown; “Open door will itemize the request repairs with their cost to have the repair completed and will provide the Seller a credit in-lieu of repairs option”

That resulted in 15K more in the seller’s pocket before Open Door’s “repair negotiation” which often results in additional reductions.  This is not to pick on Open Door (or any of their ilk such as Offer Pad, Iknock, etc.) but rather to point out that sellers will always net more on the open market – if their home is marketed to the most buyers possible.  If the goal is the most money, shouldn’t this be a last resort and not a first?

Russell & Wendy

(Mostly Wendy)

Mid-Year Market Update

As 2017 reaches the halfway mark – the trends have solidified. Not surprisingly, supply continues to be constrained under 300K. Most severely constrained is supply under 200K – in Maricopa & Pinal counties it is down a whopping 34% from this time last year. Appreciation is remaining strong. Demand has only recently showed a slight weakening – but so mild as to really have no effect at all. For those who prefer a market snapshot, that is about all you need to know. For those of you who prefer more nuanced detail, read on.
 
In analyzing the market, Michael Orr of the Cromford Report uses the Contract Ratio to determine how “hot” a market is. It specifically measures the number of completed sales contracts relative to the supply of active listings. According to the Cromford report, the under 300K price range has the strongest contract ratios since 2011. The 300K-400K range is not as hot as it was in 2013. 400K-600K is not at hot as 2012 & 2013; 600K-1 million is not as hot as 2012 & 2013; 1 million – 2 million the coolest year since 2011; over 2 million is the coolest year since 2012. To further quote him:
 
“The contract ratio stands at 66.5 for the overall market, the highest number for the start of any month since August 2013. This number is convincing evidence of a hot market because in 2013, as in 2011 through 2012, the high contract ratios were amplified by the large number of short sales that hung around under contract for a long time without closing. These have disappeared to just a trickle today.
 
So in summary almost the whole market is humming along with all cylinders firing. However there is little sign that it is going to move up a gear from here… We are at a point where the seller remains in firm control but the seller’s advantage is no longer growing stronger.
 
Whether that brings any significant relief to buyers I very much doubt, because we are entering the period, from early May to early October, when active listing counts tends to fall back, leaving even less supply for them to choose from. In fact if they fall any faster than average that may completely counteract the slight fall in demand we are currently seeing.”
 
Given the strength most sellers have experienced and the appreciation rates of the last few years, we are starting to hear rumors that the “Phoenix market is almost back to 2006 pricing” or “we are experiencing another bubble”. Both statements are false. Read that again, both statements are false. Analyzing exactly “how far” the valley has to go to get back to the peak of housing pricing is far more complex than most realize. Different parts of the valley peaked at different times, price points reacted differently and fell by differing percentages, and different types of housing (i.e. single family, townhouse, mobile homes) also had differing falls and rises. But in analyzing these factors, no one has better numbers than Michael Orr. As he explains:
 
“…prices in Greater Phoenix still have a long way to go before they return to the peaks before the housing crash…
 
It is very noteworthy that before the crash, condos & townhouses used to be cheaper than single-family homes on a $/SF basis, but that at present they are more expensive and are appreciating faster. As a result they have far less to go to get back to their peak level. Mobile homes have always been much more affordable than the other types, but they have recovered closer to their peak. They only have 16.7% to go and are currently appreciating faster than single family homes but not as quickly as condo/townhouse properties.
 
We also note that homes over 3,000 have a huge way to go (almost 50%) before re-attaining their peak. They are also increasing in price the slowest, especially slow for homes between 4,000 and 5,000 sq. ft.
 
In 2017, it appears, from an appreciation point of view, to be an advantage for a home to be closer to the center of the valley, smaller than 2,000 sq. ft., affordable and either attached or mobile. Large, expensive single-family homes on the outskirts are appreciating the slowest of all property types and have the furthest to go to re-attain the heights before the housing crash…
 
Prices are not back to the peak 2006 levels and I am somewhat surprised to see claims elsewhere that this is not too far away for Greater Phoenix. We still have a long way to go for most parts of the valley, especially if we are measuring the monthly average price per square foot. The current average $/SF for all areas & types is $151.29. This would have to increase by 26% to get back to the May 2006 peak of $190.61.
 
Those measuring monthly median sales prices do not have so far to go, but we are currently at $234,900 while the peak was $267,000 (attained on June 16, 2006). We need 14% appreciation to get back to the prior peak median sales price.”
 
So although we are not at peak pricing, we are at appropriate pricing respective to demand/supply. Real estate does very well at a 2-7% appreciation rate per year. The valley is no exception.

There is NO Bubble Here!

Recently, a very sweet client who is an avid reader of our newspaper (thank you for both being a client and reader) wondered if we would be doing an article soon about preparing your home for sale.  I told her that would-be buyers and sellers are so concerned about the state of the market, that lately we have devoted every issue solely to that subject.  Ever since the debacle of the “housing bubble” over a decade ago, it is understandable that consumers need reassurance that our recovered market is NOT a new “bubble”.  Fears are best addressed by facts, so for those who need reassurance that we are not in a second bubble we will address that.  But for those who are considering selling and would like some advice on what to do to prepare, we will address that as well.

With those promises in mind, first let us examine why we are not in a bubble (i.e. repeating the sins of the past).  No one explains the facts better than Michael Orr of the Cromford Report.  As he points out:

“In some parts of the valley, the market is so hot that a few people have been drawing parallels with 2005 and expressing fear of a bubble. While I agree that the Southeast Valley, Pinal County and parts of the Northwest Valley are much hotter than they have been for a while, the market is more akin to 2013 than 2005. 

I think some people forget quite how ridiculous 2005 was. It was exactly 12 years ago that:

Days of Inventory stood at 28 (currently 85)

Months of supply was 0.9 (currently 2.8)

Annual appreciation rate was 27.9% (currently 6.8%)

Dollar volume was up 43.9% annually (currently up 14.6%)

Listing success rate was 84.3% (currently 81.9%)

Average percent of list for closed listings was 99.16% (currently 97.69%)

New homes sales were 42,724 a year just in Maricopa County (currently 13,958)

The Greater Phoenix market has a long way to go before conditions get bubbly, and we should remember how few skeptics there were in 2005 that the market could ever go down. Now there are skeptics everywhere, which is a very good reason that another bubble is unlikely to develop. The next housing bubble is likely once everyone who experienced the last one has retired or passed away.”

We can only hope we are retired by the next one.  We have been through two housing meltdowns – the first in 1989 when the S&L’s went under, and the more infamous and severe mortgage meltdown that began in August of 2007.  We are hoping 3 is NOT a charm in this case.

Now to our promise to address how to prepare your home for sale, there are some tips that are not surprising but still worth reviewing.  But first, let’s look at the underlying principles that should guide you in prepping your home for sale.  These are – never bring your home significantly above the ceiling for your neighborhood (i.e. don’t over-improve for the basic value of the area) and never spend a dollar to get a dollar.  Any improvements should return in excess of the expense to make the improvement.

Hence, some of the best preparations cost little to nothing.  Here are our suggestions:

Improve your landscaping. Curb appeal is the first impression made upon a buyer and can determine if they even will enter your home. Mow the lawn, prune the bushes, weed the garden and plant flowers.

Clean the outside. A sloppy exterior will make buyers think you’ve slacked off on interior maintenance as well. Be sure to clean the sidewalks and front doors (no cobwebs!)  Replace the front door mat if it looks worn.  Look at the front door – does it need a fresh coat of paint or refinishing?  A new color can make it pop and don’t forget the house numbers so they can be seen.

Remove clutter and depersonalize. Clutter can make a home look smaller visually than it is.  Remember in the buyer’s mind (and the appraiser’s) size is equal to value – so you want it to look open and inviting.  Pack away clutter and make sure furniture is appropriate to the scale of the room. It is also important to depersonalize, but we believe some agents go overboard instructing sellers to have no personal photos of any kind.  We think some well- placed photos are appropriate, but an overload of photos, children’s art and religious symbols can be distracting and impede the charm of the home. Clean up by renting a storage unit if needed for knickknacks, photos, extra or oversized furniture and other personal items.

Organize closets and drawers. Messy closets give the appearance that your home doesn’t have enough storage space.  Box up extra clothing and clutter.  If you cannot rent storage, then pick the garage or one bedroom for boxed items.

Take color down a notch. You might like your bright blue family room, but it may sour buyers. Paint your walls a neutral color that will appeal to a wide range of buyers.  When we are selling a home, we are no longer decorating for the current owner but rather the future owner.

Eliminate bad odors. We can all become a bit nose blind.  Hide the litter box and spray air neutralizer throughout your home.  Make sure your home smells fresh.

Some sellers wonder if they should hire a home inspector prior to placing the home for sale.  If you are concerned that you may have deferred maintenance on numerous items, then it may be worth the money.  On the other hand – addressing specific concerns such as getting the A/C serviced and a roofer if you have roofing concerns may be the better path.  Most sellers do not need to pay for an inspection only to have their buyer get one as well.

In closing, don’t miss the point that differing price points have differing standards.  A $250,000 home will not have the same buyer expectations as a 2.5 million dollar home.  Curious about the specifics of your home?  Our preference is to tour the home with you and make specific recommendations based on your unique circumstances.  As always, we are here to advise and help.

Russell & Wendy Shaw (mostly Wendy)

The Trends Continue

Supply continues to be the story in our market.  But like most blanket statements – “supply is down” – the real picture is always a bit more nuanced.  Supply, like demand, behaves differently depending on the price points.  Looking at a broad market overview, active listings counts are down.  When active listings decline in the first quarter, the very time active supply should be building, it is a strong signal that supply is weak.

Not surprisingly, the most constricted inventory continues to be in the 50K-200K range.  As Michael Orr of the Cromford Report comments:

“Under $200K, total supply has fallen another 20% since last year, when it was already tight, so buyers looking for homes in this price range are going find it tough going, as they have for a long time now.”

Perhaps not as predictable, active listings rose in every other price range.  That’s right – active listing counts are up in the other prices points!  As he continues:

“Active listing counts fell for the price ranges between $50K and $200K, but rose in every other price range. The greatest percentage rise in active listings over the last month was for $800K to $1M which saw an increase of 10%.”

Does that mean it is a seller’s market under 200K but a buyer’s market in every other price range?  No.  Again the answers are more nuanced.  Although supply is up – so is demand.  The growth in demand is exceeding the growth in supply.  Increasing supplies are easily being consumed, bringing the supply down compared to last year’s numbers.  The Cromford Report continues:

“Between $200K and $2M, supply is down about 10% compared with this time last year. However demand has grown much more strongly for the $200K to $600K range than above $600K, so the balance in the market favors sellers under $600K but is more balanced above $600K.

Over $2M, we have roughly the same supply as last year, which is to say, far more than adequate. In most areas it is a buyer’s market in this top end with the sales rate a little weaker than a year ago.”

So far closed sales are running about 12% over last year.  But the under contract numbers are only up by approximately .4%.  Does that mean demand is weakening?  Perhaps, but more likely the numbers are being constrained by the lack of inventory where demand is the highest.  Buyers shopping in the 200K and under range are frustrated trying to find a home that doesn’t have multiple competing offers. As supply in this price range continues to evaporate, that demand is looking less and less likely to be fulfilled.  Not surprisingly appreciation, particularly in the lower price ranges, continues to climb.

Perhaps the clearest indicator of a healthy market is the “listing success rate”.  This is the percentage of homes that will sell while listed.  The market average seems to hover around 70% in a reasonably healthy market. As a point of comparison, the listing success rate in 2008 (we shudder recalling) hit a low of 22.8%. Right now the listing success rate is soaring. At the moment, traditional home sellers priced under 200k are experiencing an 88% success rate.  HUD & REO (foreclosed) homes in the price range are experiencing 100% & 96% success, respectively.  500K and under homes are succeeding at an 83% rate.  Numbers this high haven’t been seen since 2013 when the mix of the market was largely distressed sales.

In short, overall we have a very healthy market.  Wondering about the specifics of your neighborhood?  We are happy to provide a supply demand analysis tailored to your home.

Russell & Wendy

(mostly Wendy)