The Slow Motion Market

The Greater Phoenix real estate market is not much of a headline grabber.  In fact, the marketplace reminds me of a Saturday Night Live skit I watched recently “Pilates – so hard and so boring”. Yup, we see some similarities.  The market has slowly eroded into a sort of balance between supply and demand. However, as we so often have pointed out, to paint the valley with one paintbrush is simplistic and inaccurate.  Specific price points and areas behave uniquely. Of the 17 largest municipalities, 10 currently favor sellers – they are in descending strength: Chandler, Gilbert, Glendale, Tempe, Mesa, Avondale, Phoenix, Fountain Hills, Scottsdale, & Peoria.  Two are in balance, Paradise Valley and Surprise.  Favoring buyers- Cave Creek, Goodyear, Queen Creek, Maricopa, and Buckeye. For those interested in overall market trends, read on.

𝗦𝘂𝗽𝗽𝗹𝘆

Supply has been quietly growing since the start of 2024 and as of this writing, there are over 17,500 listings without a contract.  While this is below the long-term average, as the Cromford Report points out it is still the highest total for the end of the first quarter since 2019. It is also worth noting how unusual it is for supply to grow during March(up 2.8%) during the peak of the spring buying season.  Usually spring buyers are so thick on the ground that supply dwindles.  Not so this year.  As the CromfordReport notes: “Listings under contract are only down 6% compared to last year, but active listings are up 26%.”

Additionally, resale sellers are competing more than ever against builders.  In fact, builders have grown their market share by offering lower than market interest rates (i.e. bulk buying loan money).  That strategy is paying off as new home market share is now 22.6%, while only 3 years ago they were less than 15% of the total units sold in residential homes & townhouse/condo sales. The Cromford Report further examines this:

“Re-sales have been suffering from strong competition from new homes and this source of supply is looking stronger than last year. In February there were 2,810 single-family home permits across Maricopa and Pinal counties which is the highest number since March 2022 and up 107% compared to February last year.

Multi-family permits for February were lower at 1,147 units, down 51% from a year ago. However multi-family permits are a very lumpy number which fluctuates wildly from month to month. It makes more sense to look at an annual running total. This stands at over 20,000 units, which is twice the level we regarded as normal until 2022.

Sellers should expect to be facing increased competition from the new home builders over the coming 12 months.”

𝗗𝗲𝗺𝗮𝗻𝗱

First quarter demand could best be described as anemic, managing to pull even lower numbers that 2023. (Note: 2023 was a very low volume market historically – so lowerthan low is not good news).  The Cromford Report comments:

“Demand remains low and the number of pending listings fell 3.5% from last month and stands over 9% below this time last year. Although the March closed listing count was up 17% from February, this is far less of an increase than we would see in a normal year and the monthly total is down as much as 12% from March 2023. Demand has been weak for a long time and is starting to show signs of falling further. The annual sales rate is now down to the lowest it has been since 2009. As we have pointed out many times, demand for new homes remains far stronger than for re-sales.”

“Everyone is waiting to see if mortgage rates might fall and spark some buyer enthusiasm, but all forecasts of these rates have proven to be unreliable so far.” With inflation still looming as an issue, there seems little indication from the feds that bank overnight rates will be lowered anytime soon.

𝗶𝗕𝘂𝘆𝗲𝗿𝘀

It’s been awhile since we have commented on the iBuyers(Opendoor, Offerpad).  For those who are unfamiliar, these are the companies who give you a “cash offer“ without going through the traditional sales process on the open market.  They buy for profit – theirs, not yours.

At one time the iBuyers reached a market share of about 5.7%.  Now they are only about 1% of the market. Both companies’ monthly volume is 90% below their peak.  Why?  The average iBuyer offer (and this goes for the other “we pay cash for your home guys”) is about 25-30%below market value.  Consumers have gotten wise to this.  While “no commission” sounds great – it comes at a high price.  It is a fair statement to say that -unlike Realtors -cash buyers are your adversary, not your advocate.  If you want market value, you need to be on the market.

𝗧𝗮𝗸𝗲𝗮𝘄𝗮𝘆𝘀

At the moment, the market is quiet and fairly stable.  Since January of 2023, prices have generally been moving higher.  Prices have risen 7.3% over the last 12 months per the Cromford Report and the market is summarized thusly:  

“A one-word summary of the current state of the market would be insipid. Volumes are unusually low but the market is stable and the level of distress remains close to record lows. There is also little sign of a significant change in the near term so those hoping for a major drop in prices are no doubt indulging in wishful thinking. We are heading slowly toward balanced market conditions so the prospect for a rapid rise in prices is also minimal.”

Whether buyer or seller – a stable market does present opportunities.  Contact us for ways to maximize your dollars.  We are your advocates.

Russell & Wendy Shaw

(Mostly Wendy)

The Goldilocks Effect: Phoenix’s Spring Housing Market Hits the Balance

We are now in the heart of the spring selling season and yet it doesn’t feel like prime time.  The market has been quieter than we had anticipated at the beginning of the year.  The greater Phoenix market has drifted into a balance – as homes for sale have slowly accumulated and demand has waned under the pressure of rising interest rates. 

The numbers below provided by Tom Ruff of the Stat as well as the Cromford Report –  confirm 2024 first quarter lackluster numbers:   

• In the first quarter, demand was approximately 5% lower year over year. (Note: 2023 was a very low volume market historically)

• In February and March, in terms of sales per day, there were 15 fewer sales per day this year compared to last.

• Demand is down approximately 26.02% from the first quarter of 2020. (pre-COVID)

• Sales volume for Q1 2024 is down 31.61% from Q1 2021. (COVID buying frenzy)

• The median sales price is 5.65% higher year over year, home prices are stable.

• Listings under contract are only down 6% compared to last year, but active listings are up 26%.

• Flip sales are down 74% from 2 years ago and at a level comparable to 2015.

The luxury market is still holding up (although also not as strong as last year) as it is generally unaffected by interest rates.  Additionally, builders have grown their market share by offering lower than market rates (i.e. bulk buying loan money).  That strategy is paying off as new home market share is now 22.6%, while only 3 years ago they were less than 15% of the total units sold in residential homes & townhouse/condo sales.

Takeaways:  Sellers now are competing again for buyers especially against new builds and should look to their REALTOR® for advice on how to maximize time on market and net.  Prices are holding at the moment.

Buyers should be relieved to see more home choices than in years accompanied by stable pricing.  Interest rate concerns can be addressed by rate buy downs (ask us!) or by purchasing a new build.

Whether buyer or seller – a quiet market does present opportunities.  Contact us for ways to maximize your dollars.

Russell & Wendy Shaw

(mostly Wendy)

Market Update March 2024

𝗧𝗵𝗲 𝗠𝗮𝗿𝗸𝗲𝘁 𝗯𝘆 𝘁𝗵𝗲 𝗡𝘂𝗺𝗯𝗲𝗿𝘀

Now that the peak home buying season is upon us – we have a little more data on how the market is performing.  No pearl clutching headlines here, but still, we find it interesting (accusations of being a geek might be valid) and hope you will as well.

𝗦𝘂𝗽𝗽𝗹𝘆 – Supply is up 14% over last year but still 31% below normal according to the Cromford Report.  Compare the following numbers just for contrast.  We have as of the writing of this report – 16,886 active listings vs. 4400 just 2 years ago.  Wow.  Below normal looks pretty normal by comparison. As usual though, the numbers need further examination. It is the top end of the market is where the supply is plentiful.  Homes over 10 million currently have a2.6 year supply. Between 5-10 million – 16 months supply.  Between 3-5 million, 8 months of supply.  Like price, location also determines supply.  Outlying areas have more supply such as Buckeye, Maricopa and Casa Grande.  Butthat shifts the closer homes are to the city center as the Cromford Report explains:” … many cities that are closer to Phoenix and are dominated by homes under $1 million still have a tight supply and buyers outnumber sellers in most of these areas.” The moral:  marketplaces are really a combination of micro markets that must be independently evaluated.

𝗗𝗲𝗺𝗮𝗻𝗱 – Not shockingly, higher interest rates are keeping buyer demand below normal levels. Depending on one’s view – this is not entirely bad news.  Why?  Price. With supply and demand somewhat in abeyance, pricing is fairlystable.    As the Cromford Report shares:

“…Those who have been keeping these updates over the past year have probably noticed that the median sales price has barely moved for 10 months. Starting at $440,000 from June-July 2023, stagnating at $435,000 from September-December, dropping to $430,000 from January-February 2024, and now back up to $441,000 in March. While the current appreciation rate from last March measures +5.8%, over the next 2 months this will start to move closer to 3%, which is in line with the rate of inflation. This 10-month stagnation in price, which has endured erratic mortgage rates ranging from 7-8%, has allowed some breathing room for annual incomes to catch up to prices”

𝗦𝘂𝗺𝗺𝗮𝗿𝘆

“There is still no sign of a market crash in the short or medium term, but the market is struggling to gain traction. The healthy amount of incoming supply is not quite matched by a small improvement in demand and the balance between sellers and buyers only favors sellers by a small amount when considering the market as a whole. In many sectors of the market, buyers have more negotiating room, even though, judging by the recent price movements, most of them do not seem to realize this..”

If the last few years have taught us nothing else – markets can shift sometimes unexpectedly.  As always, we will keep you informed when we see it.

Russell & Wendy Shaw

(Mostly Wendy)

2024.. Two Months Does not a Market Make

We are only 60+ days into 2024 and we are studying every market indicator looking for clues as to what this year is likely to bring.  The problem is that trends require sufficient time and strong signals.  We have neither to date.  

The fact that this is an election year leads most people to assume that the election will be an outsized influence on housing, specifically mortgage rates and pricing.  We love hearing the theories, but it is not true.  To quote the Cromford Report “the main influence on the housing market comes from policies, not the elections themselves”.  Now there is a market that responds to elections – the stock market.  The last four elections saw the stock market respond positively afterwards.  That in turn can affect a portion of the housing market.  Both the luxury market as well as the 55+ market rely more heavily on cash purchases. Positive changes in portfolios can benefit demand.  Could we see the election affect the stock market again this year? Likely.

But if housing fundamentals are not directly affected by elections then it leads us right back to the basics – supply and demand.  

𝗗𝗲𝗺𝗮𝗻𝗱

It comes as no shock that demand was tepid at best in 2023 (we are in search of a better description – abysmal?) The good news is it appears demand hit bottom in 2023. The bad news? Demand is still fairly anemic.  The Cromford Report expounds further:

“Although demand has improved a little since late 2023, it remains very subdued and is having difficulty catching up to last year, which was pretty poor in the first place. With typical 30-year fixed mortgage rates over 7% again, we are not seeing much enthusiasm among buyers, who were clearly hoping rates would fall below 6.5% at least. Last year the market caught a second wind in April but ran out of puff 2 months later. It is by no means clear what it will do in 2024, but so far it is merely ticking over, providing very little to get excited about.”

𝗦𝘂𝗽𝗽𝗹𝘆

While low demand was grabbing the headlines in 2023, most missed that the supply of homes for sale was actually lower and exerted a greater influence on the market than demand.  Sellers hung on to their low interest rate homes and stepped to the sidelines at the same time demand was dropping due to soaring interest rates.  The result was a very low volume of homes sold.  The annual rate of homes sold (sales rate) has stopped falling – but the bad news is it hasn’t risen significantly. The Cromford Report shares this:

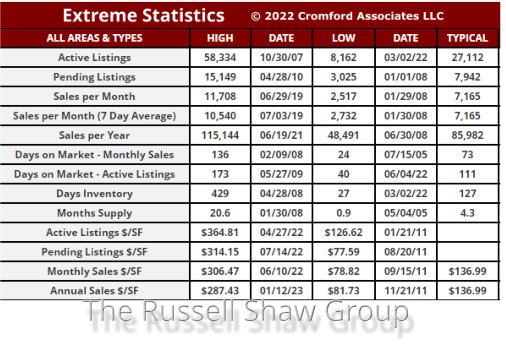
Listing under contract counts continue to be underwhelming, only reaching 8,182 after 7 weeks of the year. The same time last year we had 8,877 and 12,131 the year before…

We appear to be stuck at the very low rate of between 72,100 and 72,600 closed listings per year across all areas & types. Just 2 years ago we were at 110,000, so we are missing some 38,000 deals compared with then. Mortgage interest rates have been rising again for the last 3 weeks, so a volume breakout is looking unlikely in the short term. If we were sailors we would call this the doldrums.

𝗠𝗮𝗿𝗸𝗲𝘁 𝘀𝗲𝗴𝗺𝗲𝗻𝘁𝘀

Real estate markets can perform differently based on geography as well as price points.  Currently, 10 of the 17 largest areas are favoring sellers.  They are in descending strength: Chandler, Gilbert, Glendale, Fountain Hills, Phoenix, Mesa, Tempe, Avondale, Scottsdale, & Peoria. 3 Cities are balanced: Cave Creek, Paradise Valley, & Surprise 4 are buyer markets:  Goodyear, Queen Creek, Buckeye and Maricopa.

Price point also seems to be dictating the experience for buyers and sellers. The healthiest price segment is the mid-range homes closer to the center of Phoenix. Mid-range homes in the more distant areas are getting too much supply to perform as in town properties. Luxury which performed strongly in 2023 is now experiencing surging supply.  As the Cromford Report shares: “We still see weakness in the top end of the market. Demand remains relatively healthy but supply is much stronger than in 2023, especially for homes over $2 million. Cave Creek is doing better, but is recovering from very weak 4Q of 2023.”

𝗦𝘂𝗺𝗺𝗮𝗿𝘆

Having read this far, you may rightfully ask for clarity. What does this information bode for the 2024 market?  Exactly – not much – a rather mixed bag with no significant changes yet.  As the Cromford Report sagely states:

“Messages from the data are giving us mixed signals. The signals are weak too. Demand is improving but so is supply. Normally this would lead to greater volume but any growth in sales is so slow that it is almost imperceptible, when seasonality is taken into account.

Last year we saw 60.6% growth in listings under contract on February 11 compared with the start of the year. This year the growth is 59.9%, very slightly worse and starting at a lower base point.

Altogether there is not much to get excited about if you are longing for positive movement. On the other hand, there is also not much to get excited about if you are hoping for the market to crash. I have nothing to satisfy either of these positions. Arizona is famous for its boom and bust real estate cycles, but at this moment it is very much stuck in neutral.

2024 so far looks likely to be a version of 2023 but with stability in home appreciation and maybe even improved affordability as incomes rise. Interest rates remain the wildcard.  As always we will continue to track 2024 trends and report it here first.

Russell & Wendy

Mostly Wendy

Market Update February 2024

2024… So Far

We are only 45+ days into 2024 and we are anxiously trying to read the tea leaves for what this year will bring.  The fact that this is an election year leads most people to assume that the election will be an outsized influence on housing, specifically mortgage rates and pricing.  We love hearing the theories, but it is not true.  To quote the Cromford Report “the main influence on the housing market comes from policies, not the elections themselves”.  Now there is some truth that the stock market responds to elections – at least the last 4 elections saw the stock market respond positively afterwards.  The stock market influences the luxury market as well as the 55+ market.  Could we see the election affect the stock market again this year? Likely.

But if housing is not directly affected by elections, it leads us right back to the basics – supply and demand.  It comes as no shock that demand was tepid at best in 2023 (we are in search of a better description – abysmal?) The good news it appears demand reached bottom in 2023. Demand is now somewhat improved, even if still fairly anemic. 

While low demand was grabbing the headlines in 2023, most missed that the supply of homes for sale was actually lower than demand and a greater influence on the market.  Sellers hung on to their low interest rates homes and stepped to the sidelines as demand was reacting to soaring interest rates.  The result was a very low volume of homes sold.  The annual rate of homes sold (sales rate) has stopped falling – but the bad news is it hasn’t risen significantly. The Cromford Report shares this:

We appear to be stuck at the very low rate of between 72,100 and 72,600 closed listings per year across all areas & types. Just 2 years ago we were at 110,000, so we are missing some 38,000 deals compared with then. Mortgage interest rates have been rising again for the last 3 weeks, so a volume breakout is looking unlikely in the short term.

If we were sailors we would call this the doldrums.

What do we expect in 2024?  Likely a version of 2023 but with stability in home appreciation and maybe even improved affordability as incomes rise. The below 400K market remains strong for sellers with limited inventory while the luxury market is currently swelling with new supply.  Price point seems to be dictating the experience for buyers and sellers.  As always we will continue to track 2024 trends and report it here first.

Russell & Wendy

Mostly Wendy

Market Update January 2024

The Housing Market Shifts Slightly Towards Sellers

2024 began with a slight advantage for home sellers.  Why?  December typically ends with less active listings every year as a number of listings expire on the 31st.  Additionally, we saw a little bump in buyer demand as interest rates became more attractive.  Those two small changes pushed the market out of the balanced zone (which only lasted 7 weeks) to one that slightly favors sellers.

But saying we are in a slight sellers’ market is still misleading as most generalities are. The luxury market has performed completely differently than the rest of the market – as the luxury market is not interest rate sensitive.  Beyond price points, geographic submarkets can also perform uniquely.  As of the writing of this article, here is where the geographic submarkets stand according to the Cromford Report:

“Not all cities are in a seller’s market, the distribution is as follows from strongest-to-weakest:

Seller’s Markets: Tolleson, Apache Junction, Fountain Hills, Chandler, Gilbert, Laveen, El Mirage, Anthem, Glendale, Sun Lakes, Phoenix, Scottsdale, Mesa, Avondale

Balanced Markets: Tempe, Litchfield Park, Sun City West, Peoria, Goodyear, Surprise, Paradise Valley, Arizona City

Buyer’s Markets: Cave Creek, Gold Canyon, Queen Creek, Sun City, Casa Grande, Buckeye, Maricopa

Most cities are either gradually improving or holding steady in their market measures. “

This remains a muted market with contract activity well below normal (making this a good time to hug your real estate agent). As the Cromford Report states:  “We are starting 2024 with one of the lowest counts of listings under contract we have ever recorded for the start of any year (5,127). We measured 5,456 last year and 9,393 in 2022. We have to go back all the way to the dark days of 2008 to find a lower count (3,468). 2007 was also very bad, but at 5,197 it just beats the 2024 reading.” Gulp.  If we compare unfavorably to 2007 that is anemic indeed.

What will 2024 bring?  The Cromford Report offers this: “It’s not reasonable to expect another insane market with skyrocketing prices like 2020-2021, or another 12.5% drop in values like 2022. It could be quite boring in terms of price for the first quarter, but uplifting with more traditional home buyers getting back in the game. “ Boring sounds kind of nice, doesn’t it?

Russell & Wendy Shaw

(Mostly Wendy)

Crystal Ball for 2024

With very few exceptions, the housing market begins every year with a question:  what will this year’s housing market bring?  The truth is that projecting beyond a few months enters one into the field of guessing, as there is no real estate Nostradamus.  But there are data points (courtesy of the Cromford Report) that tell us where we are and what the next few months may look like. 

The 2023 Housing Market ended the year in “balance”.  Of course that is a bit misleading – as there are parts of the valley favoring buyers (think outlying areas such as Buckeye, Maricopa, Pinal County) and others favoring sellers (Tolleson, Anthem, Apache Junction, El Mirage, Sun Lakes, Chandler, Laveen, and Fountain Hills).  Blending two out of balance areas doesn’t really create overall balance in the market place.  This is why knowing the actual conditions in the submarkets is critical for good buying and selling decision making. 

December is seasonally the slowest time of year for real estate and supply drops as homes come off the market for the holidays or expire by year’s end. 2023 was no exception.  But rates declining from 8.0% in October to 7% presented an opportunity for buyers to buy without too much competition and for motivated sellers to sell despite the holidays.  That drop in rates spurred demand even if only mildly and stopped the market from sliding into a buyer’s market. 

Interest rates

Interest rates have been the driving force in 2023, affecting equally both supply and demand.  Buyer demand is regulated largely by affordability, which is a combination of wages, interest rates and prices. The most volatile of these of late being interest rates. But a less visible component in the decision to buy also comes from rental rates.  The valley rental rates have been flat for the last two years courtesy of the increased rental supply from multifamily building as well as entire build to rent housing communities.   When rents are lower than the cost of purchasing – buyers become or remain renters.

Interest rates equally affect supply. Sellers are largely unwilling to replace their current 3% loans only to have to double when purchasing.  This leads to constricted supply.  Less supply combined with less demand amounts to a “shrunken market” and the number of transactions (sales) drop accordingly.  The market went from 110,435 yearly transactions in 2021 to only 86,534 in 2022 and then to an anemic 72,432 sales in 2023.  As the Cromford Report states:

“In a good strong market this number is over 100,00. We are currently below 72,600 and despite the improving interest rate picture, the annual sales rate is drifting slightly lower. This measure is free of seasonal effects, because it measures a whole year of sales activity, so if the market is improving we should see a rising trend, no matter what time of year. Admittedly closed sales counts are a trailing indicator, but it would be reasonable to expect something better than 73,000 if the market is starting to recover its mojo.”

Prices

Supply moves slowly, whereas demand is swift and responsive. If rates drop to 6% or lower we likely will see a spike in demand.  However, Sellers who are not already motivated by personal reasons to move, will be unlikely to move unless rates drop to 5% or lower.  Hence our personal belief that demand will rise before supply will meet it.   This creates the possibility that the market will shift to favor sellers again in 2024.  That is only our speculation, what seems certain is that prices are not headed downward.  The Cromford Report confirms this:

“The last 20 years have shown us that for home prices to go significantly down, we have to have an excess of homes for sale chasing too few buyers. Right now, buyers are indeed thin on the ground, but we still have overall supply well below normal and heading lower. For a housing crash we would need a flood of new homes for sale. The reason it might occur is not important, but without this flood, price will remain stable at worst…

To conclude we have any credible evidence of an imminent crash would be simply illogical. With the CMI (Cromford Market Index which indicates a balanced market at 100) above 100 we should not be seeing significant weakness in pricing, so I hope buyers are not waiting for overall price drops. Individual listings give us price cuts all the time, but these are balanced by new listings coming in at higher levels. Any price weakness is likely to be concentrated in the areas with the lowest CMI, such as Maricopa, Buckeye, Queen Creek (including San Tan Valley), Cave Creek and Surprise. Among the smaller cities, Casa Grande, Gold Canyon and Sun City look the weakest. In contrast we see strength building in Apache Junction and Litchfield Park.”

Summary

What is the takeaway for 2024?  To quote the Cromford Report:

The important stuff will happen in January. Will more than the usual number of buyers emerge due to falling mortgage rates, or will we see a surge in new listings. The balance between these two measures will determine the direction of prices in the first quarter of 2024 and anyone who tells you they already know what will happen is selling you a lie.”

For buyers, we suggest buying sooner than later as we see low probability for price drops.  For sellers, the best advice is one that works in any market:  price properly, spruce up your home to its best showing condition, and assist buyers with closings costs.  Further, as the Cromford Report sagely states:  These are the markets where quality marketing, exposure, and agent representation truly make a difference. We couldn’t agree more.

Russell & Wendy Shaw

(Mostly Wendy)

Market Update December 2023

Market Balance

“The bad news is nothing lasts forever. The good news is nothing lasts forever” J. Cole

The 2023 Housing Market is closing out in “balance”.  Of course that is a bit misleading – as there are parts of the valley favoring buyers (think outlying areas such as Buckeye, Maricopa, Pinal County) and others favoring sellers (Tolleson, Anthem, Apache Junction, El Mirage, Sun Lakes, Chandler, Laveen, and Fountain Hills).

What will 2024 bring?  Interest rates seems to be the crystal ball that will answer that question.  December is seasonally the slowest time of year for real estate. But rates declining from 8.0% in October to 7% has presented an opportunity for buyers to buy without too much competition and from sellers motivated to sell despite the holidays.  That drop in rates spurred demand and stopped the market from sliding in to a buyer’s market.  If rates drop below 7% in 2024, we could well see the market shift to favor sellers again. As Tina Tamboer of the Cromford Report states:

“The rapid decline of rates is preventing Greater Phoenix from dropping entirely into a buyer’s market at this stage, which is causing analysts to question how long the opportunity will last. The combination of a sustained balanced market and the weakest month of the year seasonally means that the best thing buyers can do is stay vigilant in their search for a home and take advantage of this quiet time. Once the New Year begins, the market could heat up quickly.”

For sellers selling now, the best advice is to price properly, spruce up your home to its best showing condition, and assist buyers with closings costs.  As the Cromford Report sagely states:  These are the markets where quality marketing, exposure, and agent representation truly make a difference.

We hope you have a happy and joyous holiday season and New Year.  We look forward to serving you in 2024.

Russell & Wendy Shaw

(Mostly Wendy)

Market Shifts

Market Shifts

The Greater Phoenix market has been steadily shifting away from sellers.  Within a few days of this writing we will be in a balanced market overall.  Eleven cities already are balanced or favor buyers – eighteen favor sellers but are eroding.

If you are a buyer – this is a wonderful time to buy.  Seasonally, there are less buyers shopping in the 4th quarter than any other time of year.  Additionally, interest rates have had the largest drop in 2023 last week – resulting in a rise in loan applications. In addition, sellers have been subjected to longer marketing times – courtesy of the market shift and higher rates scaring off buyers.  Tired sellers are often more willing to negotiate on price and buyer incentives (closing costs).  If you regretted missing the last buyer’s market – don’t make the same mistake again. As Tina Tambour of the Cromford Report shares:

“Mortgage rates have been near impossible for experts to predict over the past 18 months, however there are strong feelings that the end is near for rate hikes by the Federal Reserve. If mortgage rates decline in response, then the current market decline will be short lived.

In short, it’s a good idea for buyers to stay engaged and vigilant in identifying opportunities in November and December. Once 2024 begins, the peak home-buying season is back in swing with more buyer competition.”

If you are a seller, your best strategy is to price for today’s market – not the one we had even 2 months ago.  If you are in Surprise, Litchfield Park, Goodyear, Buckeye, Maricopa, Casa Grande, Gold Canyon and Queen Creek – you will need to price in the buyer’s favor.  Still balanced is Cave Creek, Peoria and Sun City – but will soon tip. All the other cities are still seller’s markets, but weakening fast.

Will this year’s trend continue in 2024?  No one knows. The wild card of course is mortgage rates – something that is impossible to predict accurately. For now, the best plan is to address the market at hand.  As always, we will keep you apprised of the market fluctuations so you can make informed decisions.

As a note, we are so grateful to our friends and clients who honor us every day with their trust.  Thank you from the bottom of our hearts.  We wish you a very happy Thanksgiving.

Russell & Wendy Shaw

(Mostly Wendy)

Market Blues

𝗠𝗮𝗿𝗸𝗲𝘁 𝗕𝗹𝘂𝗲𝘀

As we approach the year-end a market shift is underway. While sellers retain a slight advantage in most markets, supply has begun to rise at the fastest rate since last year. All while demand continues to erode. Every day the strength of the market is moving in the buyer’s favor.  It is no mystery why this is happening: interest rates.  Rates have hit their highest levels in 20 years.  This is having a predictable impact on demand.  With demand eroding, homes for sale begin to linger on the market causing the count of active homes to rise.  All of which adds up to “less”. Less market activity resulting in less sales. According to the Cromford Report, listings under contract fell this month another 8.6% from the dismal level last month. Closed sales were also anemic – dropping another 11% from last month.

As we approach a balanced market (which could happen as fast as the first or second week of November), the gentle upward pressure on prices also appears to be nearing an end. However, to be clear, at the moment prices are not declining.  The Cromford Report sums up the current market condition thusly:

The seller market is weakening in the wake of rising mortgage rates as we head into the 4th quarter.…This is not a reassuring situation for sellers and their confidence is much weaker than it was a couple of months ago. Buyers have a better negotiating position but those needing finance are increasingly dismayed at the cost of their monthly repayment. Both sides are unhappy, leading to weakening transaction volumes and lower closing rates. This spreads the hurt across all sectors of the housing industry.

So what are Buyers’ and Sellers’ path forward given the market headwinds?  

Our best advice is as follows:

𝗦𝗲𝗹𝗹𝗲𝗿𝘀

1. Price your home for where the market is going to be in two months, not based on the past two months of sales.  The market is moving – your price must move too.

2. Be prepared to pay seller concessions (i.e. money to buy down the buyer’s interest rate).  Last month 45% of all transactions included sellers paying towards buyer costs. That percentage is likely to go up. Builders are having great success with buyers currently due to their willingness to “buy down the interest rate”.

3. Get your home “show ready”.  In other words, when buyers have more choices as they do now – the homes with the least amount of needed work sell the quickest and for the most.

4. Don’t fall for below market investor offers.  When markets begin to lean away from sellers – too many sellers fall for the “sure thing”.  Investors pay 25-30% below market value.  If you want market value – you have to be on the market. Price to the market.   Yes it may be less than you hoped but it still 25-30% above any investor.

𝗕𝘂𝘆𝗲𝗿𝘀

1. Typically, the best time of year to buy is right now.  You have the lowest amount of buyers in the marketplace (your competition) and the most choices (homes for sale) than any other time of year.  Don’t miss the negotiation strength that confers on you.

2. Date the rate, marry the house.  Realize as a buyer, the interest rate is what is happening now.  Get the seller to help buy down your rate and wait to refinance down the road when rates improve.  If you found the right house, get it now while you can.

3. The spring buying season is March- June every year.  Buying when everyone else is buying is not the best negotiation strategy.  If you can do it now, do it (see point #1)

What will the market look like in 2024?  The truth is that predictions more than a month or two out are nearly impossible.  Many have a theory that “markets are always good in an election year”.  We have never seen anything other than antidotal data to support that popular theory. As the Cromford report shares:

A year ago, the market was looking very weak and few people imagined that $/SF could possible go up 3% in the following 12 months. This reinforces how unpredictable the market can be when looking more than a couple of months out. The best that can be done with math is a well-defined interpretation of the trend during the next 8 weeks or so. Right now these 8 weeks are not looking rosy. Just remember we felt the same way in October 2022.

Different price points and geographic areas can vary in supply and demand – creating micro- markets within the greater market.  If you are thinking of buying or selling – don’t hesitate to reach out to us with questions about your specific home sale or purchase.  We are always here to help.

As this year ends, we thank you for being our friends and clients.  We wish you a most joyous holiday season.

Russell & Wendy Shaw

(mostly Wendy)