Recently national housing statistics have made headlines regarding the diminishing demand of homebuyers. This is understandably unsettling to homeowners in the valley who recall all too 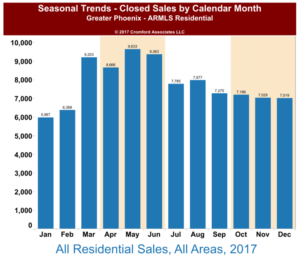 well the housing crises where supply and demand went topsy turvey. As interesting as it may be to listen to national housing statistics, they are generally antidotal. Even in the midst of the housing crisis of the “Great Recession” there were markets that saw little downturn – proving that real estate markets are local. Is the valley in the midst of dwindling demand? The short answer – a slight abating of demand is possibly underway. Is it so great to affect pricing or cause any significant impact to our market? No. This is due to the largely chronic lack of supply. Perhaps some numbers can better put this in perspective.
Demand The first thing to understand is the seasonality component of real estate – i.e. different times of the year perform differently. Headlines can rather easily claim “buyer demand is down” simply by comparing April’s numbers to September’s numbers. Buyer activity reaches its peak in April and then increasingly slows through the rest of the year. To have meaningful comparisons year over year numbers should be examined. One key measurement of buyer demand is contracts. We can then see for instance, that contracts have dropped 26% from the April peak this year, compared to a 20% drop in 2017 over the same time period. That can lead us to the conclusion that a slight weakening in demand may be underway. Slight being the keynote concept.
Supply Like demand, supply also follows a seasonal pattern. Listings typically hit their low point in August and then rise until Thanksgiving (with a large exodus of cancelling listings at the end of the year). In 2018 we hit the low point a bit early – July – and supply has been drifting upwards since. But before we hit the alarm button, the overall numbers put this in perspective. Here is an interesting analysis made in June of this year by the Cromford Report :
The total number of active listings … is 19,736 today for all areas & types across the ARMLS database. This is just slightly above June 15, 2011 when we saw 19,696. We have to go all the way back to October 2005 to find another 15th date (19,715) with lower active listings.
Active listing counts have been on a declining trend since April 2014 when we hit a short term peak of 30, 506. We would consider somewhere between 30,000 and 35,000 to be sufficient for a balanced market. The all-time record high for a 15th date is 58,195 in November 2007.
Between 30,000-35,000 active listings would be considered a balanced market. As of this writing the active listing count is at 19,860 – not even close to a balanced market (and remember, that even balanced markets do not cause price drops – they just stop or slow appreciation).
Of course, different areas and types of properties are reacting differently on supply levels. As Cromford comments:
There are some areas that have seen a dramatic rise, often from abnormally low levels. Florence is probably the best example. At the end of June we had just 100 active listings without a contract, but since then the count has shot up 38%. The trend does not affect mobile homes, but single-family listings have jumped from 71 to 111, an increase of 56% in just 8 weeks. A similar but smaller event has occurred in Casa Grande and Coolidge. The only areas outside of Pinal County with a jump like this (albeit more moderate) are Litchfield Park and Surprise.
The Answer -So what is the take away of all this? If demand is showing early signs of lessening, and some areas are seeing increasing supply – when is the tipping point? The answer is contained in the supply numbers. Again, to quote Cromford :
Fluctuations in demand are unlikely to have much impact on the market until we see an increasing trend in listing counts. This was the first sign of a slowdown in April 2005 and will be the first sign of a slowdown if and when we get one in the future. It came suddenly and unexpectedly in April 2005 and it may do the same at any time. However, nobody paid any attention in 2005 and I am assuming we are all older and wiser now. Any unusual activity in the listing counts will show up in the daily Tableau charts which we create and study each and every day.
We too watch the listing counts. When we see shifts, you will hear it from us. Until then, do not believe the headlines. As always, we are here to help you with any questions or concerns specific to your home or neighborhood.
Russell & Wendy Shaw
(Mostly Wendy)