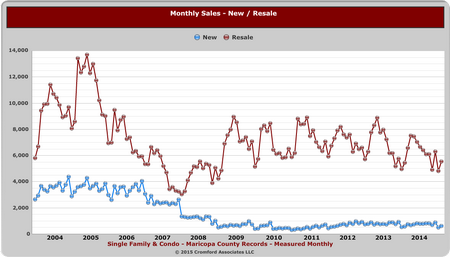
 After a year and a half of the real estate market being in the doldrums – low supply and low demand – demand has fully corrected. In fact, demand is now in a “normal†range. Supply however, has failed to follow. In fact supply is down about 15% from last year. That is great news for sellers.
In the last 2 weeks of February, demand finally began increasing. That increase appeared to primarily come from first time home buyers. Even that picture has shifted a bit, and now demand is largely coming from the move up buyers. This move up buyer has allowed improvement in higher price points as well as in most geographic areas. In real estate, this is the “trickle up theory†– that improvement begins in the lower price ranges and migrates upwards. If demand remains strong, and supply continues to be constrained, then with time, prices follow.
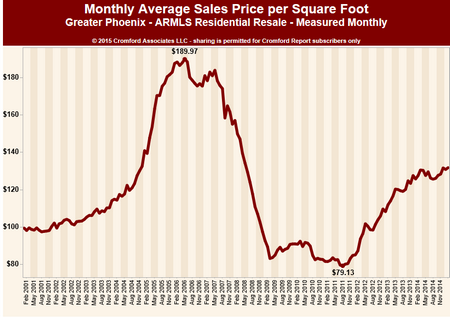
Supply and demand trends tend to follow certain patterns, ultimately adjusting with the effect of coming in to balance. For example, when supply stays low but demand accelerates, the first signs of the shift are multiple offers – often pushing contract prices above listing prices. Then the appraisals begin to come in “low†(as rising prices are not supported by historical prices) often forcing sellers to accept less and thereby artificially holding down prices. Eventually enough demand creates buyers who will pay above appraisal or enough attractive cash offers, and prices begin their climb. Higher pricing then encourages more sellers to come to market, and as supply builds price appreciation moderates. Supply and demand then are brought back in to balance.
Where are we currently in this cycle? At the moment, we are seeing multiple offers with contract pricing pushing upwards, only to be depressed by low appraisals. If this trend continues, we likely will see price increases in the next few months.
Summing up the market shift is our favorite guru, Michael Orr of the Cromford Report:
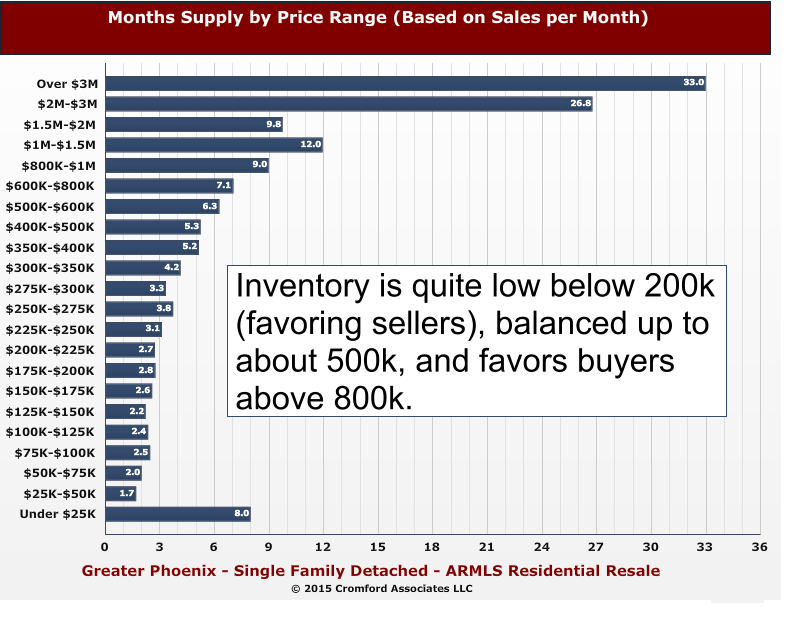
Now we are fully into the height of the prime selling season it is becoming clear that it is not the first time home buyer who is making the biggest impact. It is the move up price ranges that are doing best compared with last year.
Here are the price ranges which have growth dollar volume the most between March 2014 and March 2015:
1.      $350K-$400K – up 46%
2.      $300K-$350K – up 40%
3.      $500K-$600K – up 40%
4.      $275K-$300K – up 28%
5.      $200K-$225K – up 26%
6.      $800K-$1M – up 26%
7.      $250K-$275K – up 26%
8.      $175K-$200K – up 24%
9.      $2M-$3M – up 23%
10.   $600K-$800K – up 21%
11.   $400K-$500K – up 21%
All ranges below $125,000 are delivering lower dollar volume than last year and so are the ranges over $3 million and between $1.5 million and $2 million.
The mid range and the lower luxury ranges are where we are seeing the most strength and this is in stark contrast to last year.
All in all, encouraging news for most sellers. After a year and a half, it’s nice news to report.