In a persistently strong seller’s market – real estate newsletters can feel the opposite of news. Like the weather in Phoenix – our real estate market can be antithetical to headlines. Factually there are consistent changes, but large real estate shifts require time. So let’s review the current market patterns.
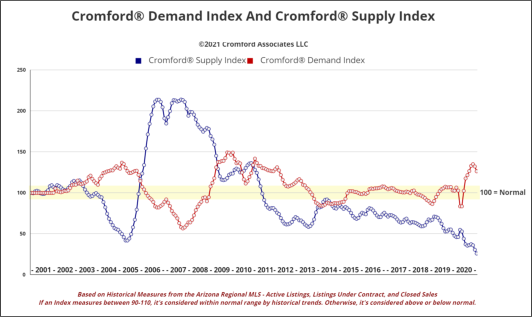
Why is this the hottest real estate market? Most people would answer that demand is driving this market, but that is a fallacy. Rather this market is being driven by the scarcity of homes for sale. Yes, our demand has been slightly above normal. But demand could drop well below normal levels and still have little impact on the market simply because the current supply is so scarce. We need about 7 times the amount of homes currently for sale to balance the market. Therefore the key to the market rebalancing is increased listings – both active and new to market – not decreased demand.
The scarcity of homes for sale is largely attributable to 15 years of under-building. Additionally new listings coming to market are lower than 2020 levels, which were not impressive to begin with. Add in some homes that are not being sold due to forbearance and other governmental programs that are artificially propping up otherwise would-be home sellers, and we simply have too few homes for sale for the number of people who want to live here.
As of the writing of this article, we can see the first signs of a slight increase of new listings coming to market. This is too early in its infancy to say if it will continue. Also, demand is weakening courtesy of rising prices. This is exactly what is supposed to happen in a healthy market – demand weakens when prices rise. Is there a rebalancing of the market on its way? Yes, but supply can take a long time to build which means that balance is a ways off.
Where are all the buyers coming from? California?
The luxury market does appear to be benefiting from inbound Californians, along with other states. The luxury market has been setting new records since mid-last year. To quote Tina Tamboer of the Cromford Report:
The luxury market has been exploding since last summer and continues to be at the strongest level ever seen in Greater Phoenix. The number of listings under contract over $1M is up 156% over last year; but the number under contract between $2M-$3M is up 296% and over $3M is up 212%. In a typical market, sales prices in this range would be landing around 93% of list price. However in the 2021 market, the sales price ratio is averaging 98% of list.
In addition to luxury buyers making a strong appearance, the purchase of second /vacation homes are up 36.2% over this time last year and rental property purchases are up 52.1% from last year according to the Cromford Report.
“It is clear that compared to last year, far more sales are going to investors and those buying second homes. The primary residence buyer seems to be the segment that is losing out. Perhaps the rising prices and interest rates are having a greater impact on these buyers (who probably have less financial resources than investors and people buying their second or third home). By itself, this is not a huge development, but it is a new sign that the market may be starting to get a little frothy. Primary residence purchases are the backbone of the market and we do not want to see a market dominated by other buyers when we are looking for signs of good health. “
Given that both resale pricing and rental rates are soaring it is not shocking that investors are making an appearance in this market. Primary residence buyers are in the market as well, they just tend to lose in multiple bid scenarios – losing to the strong cash positions of both investors and second home purchasers.
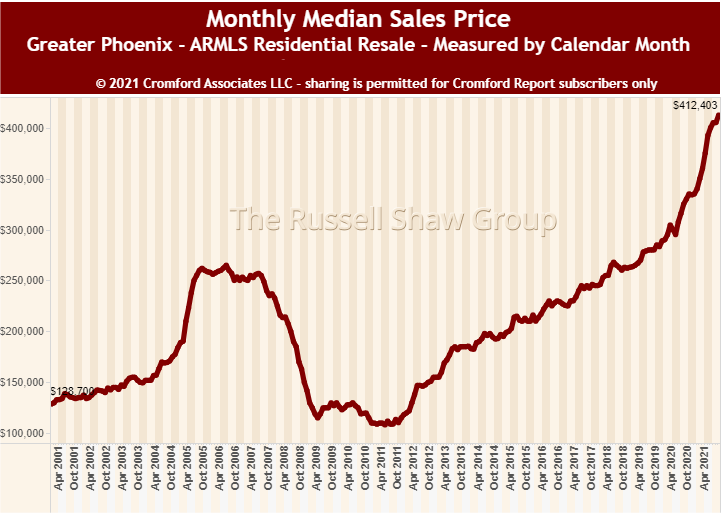
Can home prices keep rising? Are they about to drop?
Obviously home prices cannot rise forever at the current pace of 2-3% per month. As prices rise, affordability drops thereby causing a corresponding drop in demand. That allows supply to build up. Price drops only occur when supply is well in excess of demand for an extended period. Because our supply is so constricted, we fully expect price increases to continue this year- and possibly for a couple of years – as a buildup of supply takes time. Michael Orr further comments:
“This is a more significant and long-lived increase in price than any of the booms we have witnessed since the 1950s. We have over a decade of sustained under-building in the face of population growth to work off. This is not some market aberration that will quickly resolve itself. The annual appreciation rate has already exceeded 24% (measured by monthly average $/SF) and there are higher numbers to come. Also what does “cannot be sustained” mean. If it means that prices will one day be lower than today, that we would consider an unlikely prospect. At some stage the boom will fade but we expect prices to stabilize at a much higher level than 2Q 2021. In the words of Stephen Kim of Evercore ISI, we are entering housing’s “Golden Age”.
Are we in another bubble?
Although this is a topic we have previously commented on, it bears repeating. This market is not like the 2005 market (and subsequent 2007 market meltdown) despite having spiraling prices and multiple offers in common. Let’s compare:
2005 2021
Too many homes for the population Too few homes for the population
Excess of vacant homes Very few vacant homes
Wall Street fueled fraudulent lending Standard lending practices
Lack of home equity Large amounts of home equity
Rents were falling (6% in a year) Rents are rising (a 21% rise)
People believed it wasn’t a bubble (it was) Most think it is a bubble (it’s not)
The seeds of failure are sown in times of success No matter how much we discuss the extraordinary strength of the market, most sellers are still shocked when they actually experience being a seller in this market: Multiple offers, waived appraisals, as-is options, & spiraling pricing. Sellers who fail to grasp how extraordinary the current market is, are making choices that unfortunately cost them tens of thousands of dollars when they sell. Some sellers still believe the gimmicks – “online cash offer with no showings” “Sell in hours” “do it yourself” “we don’t put you on MLS so you save on the commission”. All of these pitches cost you money if you select them. What sellers can fail to understand when they sell through a limited service real estate company or on their own – is that it is the loss of the upside money is the largest expense of selling. Because sellers can easily see the expense of a commission but can’t see the sales price they could have achieved, they are vulnerable to sales pitches. The way to get top dollar is to market to the largest pool of buyers and agents, allow a sufficient amount of time for showings (in this market only 4-7 days are typically needed) and negotiating to encourage and exploit multiple offers. It is the multiple offers properly negotiated that creates the frenzy, not curtailed hours of showings or limiting the buyers who see your home. The expense of a commission is cheap compared to the loss of the upside. Having sold real estate over 40+ years, we’ve seen all the gimmicks. In those years our goal has never changed – getting you the most money. It is not uncommon that we are negotiating an additional 30k-50K in unexpected profit for sellers. Though we understand this sounds self-serving, we repeat – hard work and good marketing will always beat gimmicks. Always.