With very few exceptions, the housing market begins every year with a question: what will this year’s housing market bring? The truth is that projecting beyond a few months enters one into the field of guessing, as there is no real estate Nostradamus. But there are data points (courtesy of the Cromford Report) that tell us where we are and what the next few months may look like.
The 2023 Housing Market ended the year in “balance”. Of course that is a bit misleading – as there are parts of the valley favoring buyers (think outlying areas such as Buckeye, Maricopa, Pinal County) and others favoring sellers (Tolleson, Anthem, Apache Junction, El Mirage, Sun Lakes, Chandler, Laveen, and Fountain Hills). Blending two out of balance areas doesn’t really create overall balance in the market place. This is why knowing the actual conditions in the submarkets is critical for good buying and selling decision making.
December is seasonally the slowest time of year for real estate and supply drops as homes come off the market for the holidays or expire by year’s end. 2023 was no exception. But rates declining from 8.0% in October to 7% presented an opportunity for buyers to buy without too much competition and for motivated sellers to sell despite the holidays. That drop in rates spurred demand even if only mildly and stopped the market from sliding into a buyer’s market.
Interest rates
Interest rates have been the driving force in 2023, affecting equally both supply and demand. Buyer demand is regulated largely by affordability, which is a combination of wages, interest rates and prices. The most volatile of these of late being interest rates. But a less visible component in the decision to buy also comes from rental rates. The valley rental rates have been flat for the last two years courtesy of the increased rental supply from multifamily building as well as entire build to rent housing communities. When rents are lower than the cost of purchasing – buyers become or remain renters.
Interest rates equally affect supply. Sellers are largely unwilling to replace their current 3% loans only to have to double when purchasing. This leads to constricted supply. Less supply combined with less demand amounts to a “shrunken market” and the number of transactions (sales) drop accordingly. The market went from 110,435 yearly transactions in 2021 to only 86,534 in 2022 and then to an anemic 72,432 sales in 2023. As the Cromford Report states:
“In a good strong market this number is over 100,00. We are currently below 72,600 and despite the improving interest rate picture, the annual sales rate is drifting slightly lower. This measure is free of seasonal effects, because it measures a whole year of sales activity, so if the market is improving we should see a rising trend, no matter what time of year. Admittedly closed sales counts are a trailing indicator, but it would be reasonable to expect something better than 73,000 if the market is starting to recover its mojo.”
Prices
Supply moves slowly, whereas demand is swift and responsive. If rates drop to 6% or lower we likely will see a spike in demand. However, Sellers who are not already motivated by personal reasons to move, will be unlikely to move unless rates drop to 5% or lower. Hence our personal belief that demand will rise before supply will meet it. This creates the possibility that the market will shift to favor sellers again in 2024. That is only our speculation, what seems certain is that prices are not headed downward. The Cromford Report confirms this:
“The last 20 years have shown us that for home prices to go significantly down, we have to have an excess of homes for sale chasing too few buyers. Right now, buyers are indeed thin on the ground, but we still have overall supply well below normal and heading lower. For a housing crash we would need a flood of new homes for sale. The reason it might occur is not important, but without this flood, price will remain stable at worst…
To conclude we have any credible evidence of an imminent crash would be simply illogical. With the CMI (Cromford Market Index which indicates a balanced market at 100) above 100 we should not be seeing significant weakness in pricing, so I hope buyers are not waiting for overall price drops. Individual listings give us price cuts all the time, but these are balanced by new listings coming in at higher levels. Any price weakness is likely to be concentrated in the areas with the lowest CMI, such as Maricopa, Buckeye, Queen Creek (including San Tan Valley), Cave Creek and Surprise. Among the smaller cities, Casa Grande, Gold Canyon and Sun City look the weakest. In contrast we see strength building in Apache Junction and Litchfield Park.”
Summary
What is the takeaway for 2024? To quote the Cromford Report:
“The important stuff will happen in January. Will more than the usual number of buyers emerge due to falling mortgage rates, or will we see a surge in new listings. The balance between these two measures will determine the direction of prices in the first quarter of 2024 and anyone who tells you they already know what will happen is selling you a lie.”
For buyers, we suggest buying sooner than later as we see low probability for price drops. For sellers, the best advice is one that works in any market: price properly, spruce up your home to its best showing condition, and assist buyers with closings costs. Further, as the Cromford Report sagely states: These are the markets where quality marketing, exposure, and agent representation truly make a difference. We couldn’t agree more.
Russell & Wendy Shaw
(Mostly Wendy)
 impact looked like rather than what they assumed would happen. Let’s examine the impact in the key areas that compose a real estate market.
 and demand determine our market forecasts. Typically we see one side of the equation having a bigger impact than the other – a situation that our market is currently experiencing.
 now attempt to remedy that. While demand is more elastic (and therefore perhaps the sexier story) supply might actually be the buried headline.
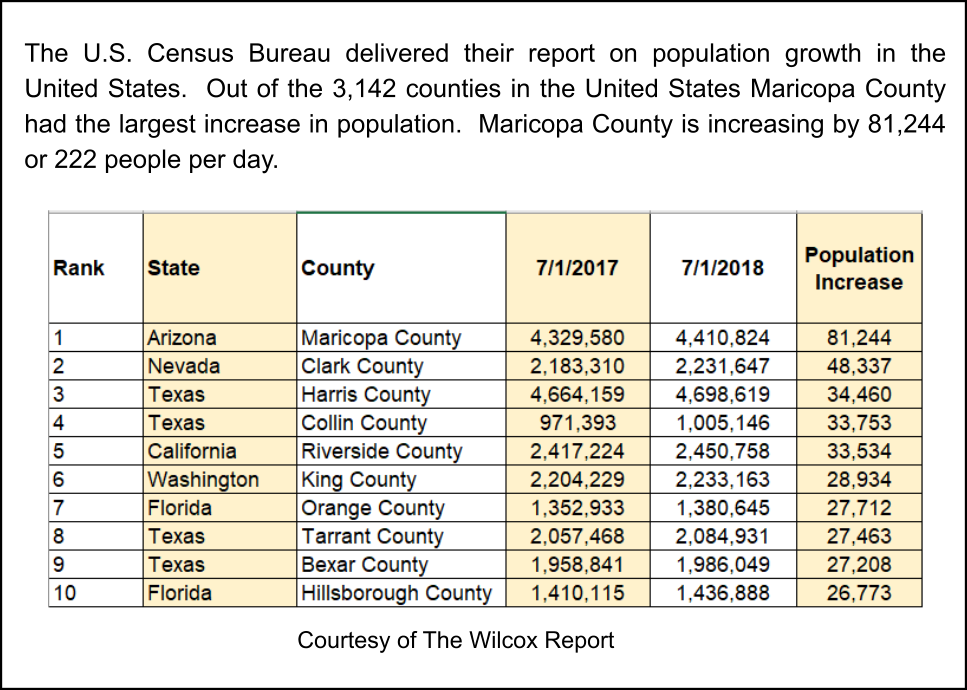 have been. We ended 2018 with a rather lackluster market due to anemic demand. Entering 2019 it looked like the market was heading towards a balanced market – something we haven’t seen in the valley for years. But buyers suddenly reversed course and began to enter the market place in strong numbers. What turned things around? Two financial factors: interest rates & raised loan limits.
 prognosticators watch closely for signs of market health. In the valley the supply side of the economic seesaw (supply & demand) has been fairly stable, if persistently undersupplied. Supply changes tend to be slow moving. Demand, as we have mentioned in the past, can change far more quickly. Jitters were set off in the last quarter of 2018 when the erosion of summer demand persisted. The erosion should not have been shocking given the hit affordability took both in years of rising prices combined with a rapid rise of interest rates. As Tom Ruff in the ARMLS Blog so brilliantly explains: “The decline in year-over-year sales volume began in October as interest rates rose. Adding angst to the problem, employees saw their 401(k)s shrink as the Dow Jones Industrial and the S&P 500 indexes fell 18.8% and 19.6% respectively between the first of October and Christmas Eve. Attempting to soothe nerves, the federal government shutdown from December 22 thru January 25. Happy Holidays everyone! “
 ultimately resulting in a balanced market.
 well the housing crises where supply and demand went topsy turvey. As interesting as it may be to listen to national housing statistics, they are generally antidotal. Even in the midst of the housing crisis of the “Great Recession” there were markets that saw little downturn – proving that real estate markets are local. Is the valley in the midst of dwindling demand? The short answer – a slight abating of demand is possibly underway. Is it so great to affect pricing or cause any significant impact to our market? No. This is due to the largely chronic lack of supply. Perhaps some numbers can better put this in perspective.
 been area specific, so while national trends are interesting, they are not particularly meaningful when interpreting a local market. New listings to MLS in the first quarter of 2018 for Maricopa and Pinal County under 400K are logging the lowest numbers for a first quarter since the Cromford Report began tracking in 2001. Not surprisingly given the low supply, appreciation is higher than it’s been in the last several years. To quote the Cromford Report: