Happy New Year! We hope that you had a wonderful holiday season.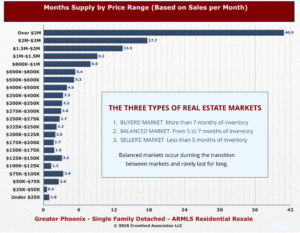
2018 closed with a bit of a whimper in the valley as buyer demand, after years of unflinching strength, finally wavered. Demand began to drop in July – rather precipitously by October – before settling in to a gentle landing to end the year. Despite lessened demand and the dreary national headlines to the contrary, 2019 begins in the valley with sellers still retaining the upper hand. To summarize the market conditions, no one says it better than Michael Orr of the Cromford Report:
“The reality in Greater Phoenix is that we have shifted from a strong seller’s market with high volumes to a moderate seller’s market with slightly lower volumes. In due course this is likely to adjust appreciation rates from the 8%-10% level to more like 6%-8%. If the CMI** drops below 120 I would change our prediction to 4%-6% but at the moment there is little sign of a fall much below 130. At a CMI of 100 we would expect appreciation. Of course things could change at any point but it would need a new factor coming into play.
The housing market has seen 3 factors put a slight dent in demand:
- Mortgage interest rates are at a much higher level than in 2017, though still far below long term averages.
- The cost of home ownership has risen faster than rents.
- The tax law changes since 2018 have removed many of the tax benefits of owner-occupied housing relative to renting.
We definitely do not have anything approaching a crash or a slump, which would require a large increase in supply. Supply remains weak because many existing homeowners are more reluctant to move. Doing so would require them to give up their existing cheap loan and take out a new more expensive one. They are tending to stay put, which is good news for the likes of Home Depot and home remodeling and redecorating companies.
Other parts of the country are reporting weaker markets at the upper levels, but in Greater Phoenix, the luxury market is looking strong. Supply of higher end homes is down from last year and demand is holding up rather well. Of course the luxury market in Arizona is priced like the mid-range market in many parts of California. Population flows are favoring Arizona too, so it looks as though Phoenix will have one of the leading housing markets over the coming year, even though it is likely to be somewhat less active than 2018.”
So what is the take-away for sellers and buyers in this market? Despite lessened demand, buyers are still exceeding the chronically low supply leaving most sellers in a gentle seller’s market. The weakened demand is however contributing to more price reductions and a greater likelihood of sellers paying buyer concessions during contract negotiations. For buyers, any plan of waiting for lower interest rates and lower prices will likely result in a very long wait. Even balanced markets typically appreciate at the level of inflation – and it is not likely to be in a balanced market in the first quarter of 2019, perhaps not even in the year. Therefore buyers will still be better served shopping in this gentle seller’s market than waiting for a buyer’s market to arrive.
Of course, neighborhoods and price points vary in their supply and demand. For details on your specific area, please contact us. We are always here to help! Thank you for all your support in 2018. Here’s to a wonderful 2019.
Russell & Wendy Shaw
(Mostly Wendy)
**Cromford Market Index; definition: is a value that provides a short term forecast for the balance of the market. It is derived from the trends in pending, active and sold listings compared with historical data over the previous four years. Values below 100 indicate a buyer’s market, while values above 100 indicate a seller’s market. A value of 100 indicates a balanced market
 ultimately resulting in a balanced market.
 indoors. In the summer, scorpions are actively hunting for food or a mate and can be found inside and outside. Scorpions like to shelter in dark cool places with an air flow, like cracks and crevices inside block fence walls or under palms tree bark.
 running when a treat bag rattles. His treat of choice is Temptations, and he has been known to send volunteers out to the store when the shelter runs low. Sinatra also has a way with the feline ladies. Thelma is his tabby, long-haired girlfriend. If you are looking for two cats, Thelma is also available and her birthday is 5/26/16. Sinatra loves to be up high, so if you have cat trees or shelves, Sinatra will make himself right at home! Home Fur Good open Thursday, Friday and Saturday from 11am – 4pm and is located at 10220 N. 32nd Street in Phoenix. Home Fur Good can also be reached by phone at 602-971-1134 or by emailing
  well the housing crises where supply and demand went topsy turvey. As interesting as it may be to listen to national housing statistics, they are generally antidotal. Even in the midst of the housing crisis of the “Great Recession” there were markets that saw little downturn – proving that real estate markets are local. Is the valley in the midst of dwindling demand? The short answer – a slight abating of demand is possibly underway. Is it so great to affect pricing or cause any significant impact to our market? No. This is due to the largely chronic lack of supply. Perhaps some numbers can better put this in perspective.
 commented in the past that we are not in a “bubble”. But a recent commentary by the Cromford Report on pricing really caught our eye. It is not surprising to us that the press routinely shares erroneous housing market information often using statistics to make a poorly examined point. Homeowners would be well advised to have a skeptic’s heart when accepting the media’s research. As British Prime Minister Benjamin Disraeli so famously said (and Mark Twain popularized) “There are three kinds of lies: lies, damned lies, and statistics.” The latest premise is that housing prices have exceeded the prices set in the 2006 market. Uh… not exactly. As no one says it better than our guru Michael Orr of the Cromford Report, here are his comments (with only bolding by us for emphasis) that explain the facts about the housing numbers:
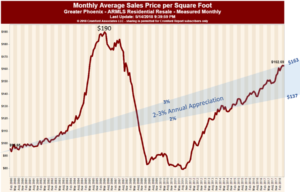
 know them. She came to the shelter with her two siblings, Tanman and Louise. Yes, all three of them are still looking for homes. Thelma is very cat social, she is most comfortable when she has feline buddies to pal around with. The perfect home for Thelma will have existing cats for her to play and lounge about with. If you are really looking to make Thelma happy, you could adopt her and her siblings. Home Fur Good is located at 10220 N. 32nd Street in Phoenix. The shelter is open Thursday, Friday and Saturday from 11-4. You can call HFG at 602-971-1334. Visit the website at
  been area specific, so while national trends are interesting, they are not particularly meaningful when interpreting a local market. New listings to MLS in the first quarter of 2018 for Maricopa and Pinal County under 400K are logging the lowest numbers for a first quarter since the Cromford Report began tracking in 2001. Not surprisingly given the low supply, appreciation is higher than it’s been in the last several years. To quote the Cromford Report: